
 Web Front-end
JS Tutorial
Javascript implementation of dynamic statistical chart development examples_javascript skills
Web Front-end
JS Tutorial
Javascript implementation of dynamic statistical chart development examples_javascript skills
Javascript implementation of dynamic statistical chart development examples_javascript skills

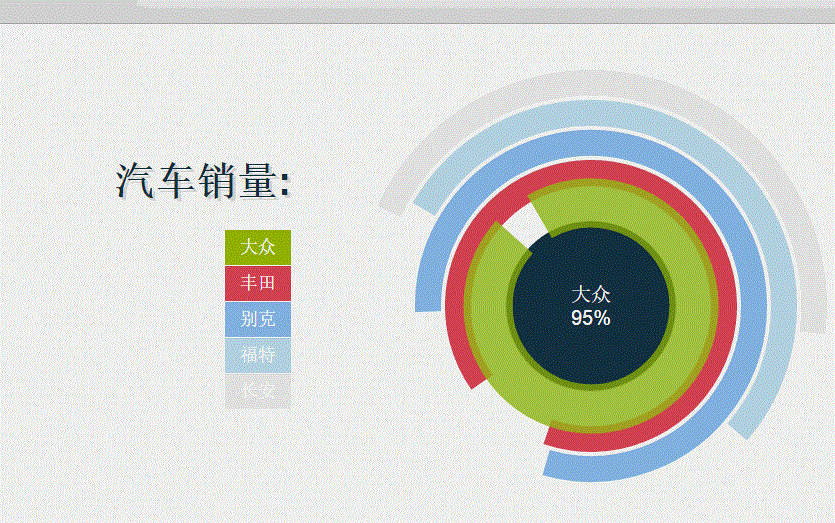
The example in this article describes the code for implementing dynamic statistical charts in JavaScript. Share it with everyone for your reference. The details are as follows:
The screenshot of the running effect is as follows:
The specific code is as follows
html code:
<div id="content">
    <div class="legend">
    <h1>汽车销量:</h1>
    <div class="skills">
    <ul>
    <li class="jq">大众</li>
    <li class="css">丰田</li>
    <li class="html">别克</li>
    <li class="php">福特</li>
    <li class="sql">长安</li>
    </ul>
    </div>
    </div>
    <div id="diagram"></div>
    </div>
    <div class="get">
    <div class="arc">
    <span class="text">大众</span>
    <input type="hidden" class="percent" value="95" />
    <input type="hidden" class="color" value="#97BE0D" />
    </div>
    <div class="arc">
    <span class="text">丰田</span>
    <input type="hidden" class="percent" value="90" />
    <input type="hidden" class="color" value="#D84F5F" />
    </div>
    <div class="arc">
    <span class="text">别克</span>
    <input type="hidden" class="percent" value="80" />
    <input type="hidden" class="color" value="#88B8E6" />
    </div>
    <div class="arc">
    <span class="text">福特</span>
    <input type="hidden" class="percent" value="53" />
    <input type="hidden" class="color" value="#BEDBE9" />
    </div>
    <div class="arc">
    <span class="text">长安</span>
    <input type="hidden" class="percent" value="45" />
    <input type="hidden" class="color" value="#EDEBEE" />
    </div>
    </div>
css code:
#content {
position:absolute;
top:50%;
left:50%;
margin:-340px 0 0 -450px;
width:900px;
height:600px;
}
.legend {
float:left;
width:250px;
margin-top:140px;
}
#content h1 {
font-family:'Cabin Sketch', arial, serif;
text-shadow:3px 3px 0 #ddd;
color:#193340;
font-size:40px;
margin-bottom:40px;
text-align:right;
}
.skills {
float:left;
clear:both;
width:100%;
}
.skills ul,
.skills li {
display:block;
list-style:none;
margin:0;
padding:0;
}
.skills li {
float:right;
clear:both;
padding:0 15px;
height:35px;
line-height:35px;
color:#fff;
margin-bottom:1px;
font-size:18px;
}
js code:
var o = {
      init: function () {
        this.diagram();
      },
      random: function (l, u) {
        return Math.floor((Math.random() * (u - l + 1)) + l);
      },
      diagram: function () {
        var r = Raphael('diagram', 600, 600),
          rad = 73;
        r.circle(300, 300, 85).attr({ stroke: 'none', fill: '#193340' });
        var title = r.text(300, 300, 'loading...').attr({
          font: '20px Arial',
          fill: '#fff'
        }).toFront();
        r.customAttributes.arc = function (value, color, rad) {
          var v = 3.6 * value,
            alpha = v == 360 ? 359.99 : v,
            random = o.random(91, 240),
            a = (random - alpha) * Math.PI / 180,
            b = random * Math.PI / 180,
            sx = 300 + rad * Math.cos(b),
            sy = 300 - rad * Math.sin(b),
            x = 300 + rad * Math.cos(a),
            y = 300 - rad * Math.sin(a),
            path = [['M', sx, sy], ['A', rad, rad, 0, +(alpha > 180), 1, x, y]];
          return { path: path, stroke: color }
        }
        $('.get').find('.arc').each(function (i) {
          var t = $(this),
            color = t.find('.color').val(),
            value = t.find('.percent').val(),
            text = t.find('.text').text();
          rad += 30;
          var z = r.path().attr({ arc: [value, color, rad], 'stroke-width': 26 });
          z.mouseover(function () {
            this.animate({ 'stroke-width': 50, opacity: .75 }, 1000, 'elastic');
            if (Raphael.type != 'VML') //solves IE problem
    this.toFront();
            title.animate({ opacity: 0 }, 500, '>', function () {
              this.attr({ text: text + '\n' + value + '%' }).animate({ opacity: 1 }, 500, '<');
            });
          }).mouseout(function () {
            this.animate({ 'stroke-width': 26, opacity: 1 }, 1000, 'elastic');
          });
        });
      }
    }
$(function () { o.init(); });I hope this article will be helpful to everyone learning JavaScript programming.

Hot AI Tools

Undresser.AI Undress
AI-powered app for creating realistic nude photos

AI Clothes Remover
Online AI tool for removing clothes from photos.

Undress AI Tool
Undress images for free

Clothoff.io
AI clothes remover

AI Hentai Generator
Generate AI Hentai for free.

Hot Article
Hot Tools

Notepad++7.3.1
Easy-to-use and free code editor

SublimeText3 Chinese version
Chinese version, very easy to use

Zend Studio 13.0.1
Powerful PHP integrated development environment

Dreamweaver CS6
Visual web development tools

SublimeText3 Mac version
God-level code editing software (SublimeText3)
Hot Topics
 1376
1376
 52
52

 ECharts and Java interface: How to quickly implement statistical charts such as line charts, bar charts, pie charts, etc.
Dec 17, 2023 pm 10:37 PM
ECharts and Java interface: How to quickly implement statistical charts such as line charts, bar charts, pie charts, etc.
Dec 17, 2023 pm 10:37 PM
ECharts and Java interface: How to quickly implement statistical charts such as line charts, bar charts, and pie charts. Specific code examples are required. With the advent of the Internet era, data analysis has become more and more important. Statistical charts are a very intuitive and powerful display method. Charts can display data more clearly, allowing people to better understand the connotation and patterns of the data. In Java development, we can use ECharts and Java interfaces to quickly display various statistical charts. ECharts is a software developed by Baidu
 How to implement an online speech recognition system using WebSocket and JavaScript
Dec 17, 2023 pm 02:54 PM
How to implement an online speech recognition system using WebSocket and JavaScript
Dec 17, 2023 pm 02:54 PM
How to use WebSocket and JavaScript to implement an online speech recognition system Introduction: With the continuous development of technology, speech recognition technology has become an important part of the field of artificial intelligence. The online speech recognition system based on WebSocket and JavaScript has the characteristics of low latency, real-time and cross-platform, and has become a widely used solution. This article will introduce how to use WebSocket and JavaScript to implement an online speech recognition system.
 WebSocket and JavaScript: key technologies for implementing real-time monitoring systems
Dec 17, 2023 pm 05:30 PM
WebSocket and JavaScript: key technologies for implementing real-time monitoring systems
Dec 17, 2023 pm 05:30 PM
WebSocket and JavaScript: Key technologies for realizing real-time monitoring systems Introduction: With the rapid development of Internet technology, real-time monitoring systems have been widely used in various fields. One of the key technologies to achieve real-time monitoring is the combination of WebSocket and JavaScript. This article will introduce the application of WebSocket and JavaScript in real-time monitoring systems, give code examples, and explain their implementation principles in detail. 1. WebSocket technology
 How to use JavaScript and WebSocket to implement a real-time online ordering system
Dec 17, 2023 pm 12:09 PM
How to use JavaScript and WebSocket to implement a real-time online ordering system
Dec 17, 2023 pm 12:09 PM
Introduction to how to use JavaScript and WebSocket to implement a real-time online ordering system: With the popularity of the Internet and the advancement of technology, more and more restaurants have begun to provide online ordering services. In order to implement a real-time online ordering system, we can use JavaScript and WebSocket technology. WebSocket is a full-duplex communication protocol based on the TCP protocol, which can realize real-time two-way communication between the client and the server. In the real-time online ordering system, when the user selects dishes and places an order
 How to implement an online reservation system using WebSocket and JavaScript
Dec 17, 2023 am 09:39 AM
How to implement an online reservation system using WebSocket and JavaScript
Dec 17, 2023 am 09:39 AM
How to use WebSocket and JavaScript to implement an online reservation system. In today's digital era, more and more businesses and services need to provide online reservation functions. It is crucial to implement an efficient and real-time online reservation system. This article will introduce how to use WebSocket and JavaScript to implement an online reservation system, and provide specific code examples. 1. What is WebSocket? WebSocket is a full-duplex method on a single TCP connection.
 ECharts and Java Interface: A Getting Started Guide to Implementing Various Types of Statistical Charts
Dec 17, 2023 pm 12:30 PM
ECharts and Java Interface: A Getting Started Guide to Implementing Various Types of Statistical Charts
Dec 17, 2023 pm 12:30 PM
ECharts and Java Interface: A Getting Started Guide to Implementing Various Types of Statistical Charts Introduction: With the widespread application of data visualization in various industries and fields, various chart libraries have also developed rapidly. ECharts is a powerful open source visualization library developed and maintained by Baidu. It has rich chart types and flexible customization capabilities. This article will introduce how to use ECharts through the Java interface to implement various types of statistical charts. Preparation Before starting, we need to ensure that the Java development environment has been installed.
 JavaScript and WebSocket: Building an efficient real-time weather forecasting system
Dec 17, 2023 pm 05:13 PM
JavaScript and WebSocket: Building an efficient real-time weather forecasting system
Dec 17, 2023 pm 05:13 PM
JavaScript and WebSocket: Building an efficient real-time weather forecast system Introduction: Today, the accuracy of weather forecasts is of great significance to daily life and decision-making. As technology develops, we can provide more accurate and reliable weather forecasts by obtaining weather data in real time. In this article, we will learn how to use JavaScript and WebSocket technology to build an efficient real-time weather forecast system. This article will demonstrate the implementation process through specific code examples. We
 Simple JavaScript Tutorial: How to Get HTTP Status Code
Jan 05, 2024 pm 06:08 PM
Simple JavaScript Tutorial: How to Get HTTP Status Code
Jan 05, 2024 pm 06:08 PM
JavaScript tutorial: How to get HTTP status code, specific code examples are required. Preface: In web development, data interaction with the server is often involved. When communicating with the server, we often need to obtain the returned HTTP status code to determine whether the operation is successful, and perform corresponding processing based on different status codes. This article will teach you how to use JavaScript to obtain HTTP status codes and provide some practical code examples. Using XMLHttpRequest
