
 Operation and Maintenance
Linux Operation and Maintenance
How to view process commands in linux
Operation and Maintenance
Linux Operation and Maintenance
How to view process commands in linux
How to view process commands in linux

Linux commands to view processes include: ps command is used to view static process statistics, top command is used to view process dynamic information, pgrep command is used to query process PID information based on conditions, and pstree command is used to view process tree information
A program is a static collection of executable machine code and data stored in an external storage medium (such as a hard disk), while a process is a computer program that is dynamically executed in the CPU and memory. In a Linux system, each program can create one or more processes after it is started. For example, the httpd program that provides Web services. When a large number of users access the Web page at the same time, the httpd program may create multiple processes to provide services. Next, we will introduce in detail how to view process commands in Linux

[Recommended course: Linux Tutorial 】
View the process
Use different command tools to view the process status from different angles.
Commonly used process viewing commands
(1) ps command
Used to view static process statistics
Common The options are as follows:
a: Display all process information under the current terminal, including processes of other users.
u: Output process information in user-oriented format.
x: Display the processes of the current user in all terminals.
-e: Display information about all processes in the system.
-l: Use long (long) format to display process information.
-f: Display process information in full format.
It should be noted that some options do not have the "-" prefix (the meaning may be different after adding the "-" prefix). It is customary to use the above options together, such as "ps aux" or "ps -elf"
Example: ps aux will display process information in the form of a simple list. As shown below
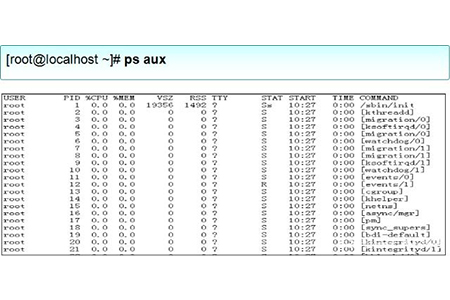
In the output information in the above picture, the first line is the list title, and the meaning of each field is described as follows:
USER: The name of the user account that started the process
PID: The ID number of the process, which is unique in the current system
TTY: On which terminal the process is running. "?" means unknown or no terminal required
STAT: shows the current status of the process, such as S (sleeping), R (running), Z (zombie),
START: The time when the process was started
TIME: The CPU time occupied by the process
COMMAND: The name of the command that started the process
%CPU: Percentage of CPU usage
%MEM: Percentage of memory usage
VSZ: Size of occupied virtual memory (swap space)
RSS: Occupied resident memory (physical memory) The size of
(2) top command
is used to view process dynamic information
Displays process rankings in a full-screen interactive interface, and real-time tracking includes The usage of system resources such as CPU and memory is refreshed every three seconds by default. Its function is basically similar to the task manager in Windows system.
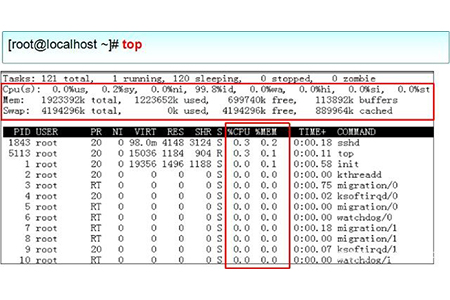
The meaning of the relevant information at the beginning of the output information in the above figure is as follows:
Tasks (system task) information: total, total number of processes; running, in progress The number of running processes; sleeping, the number of dormant processes; stopped, the number of suspended processes; zombie, the number of zombie and unresponsive processes.
CPU information: us, occupied by users; sy, occupied by kernel; ni, occupied by priority scheduling; id, occupied by idle CPU; wa, occupied by I/O waiting; hi, occupied by hardware interrupts; si, occupied by software interrupts ; st, virtualization occupation. To understand the idle CPU percentage, mainly look at the %id part.
Mem (memory) information: total, total memory space; used, used memory; free, free memory; buffers, cache area.
Swap (swap space) information: total, total swap space; used, used swap space; free, free swap space; cached, cache space.
In the full-screen operation interface of the top command, press the P key to sort the process list according to CPU usage, or press the M key to sort the process list according to the memory usage, press the N key to sort according to the startup time, and press the h key You can get online help information for the top program. Press the q key to exit the top program normally.
If you find that the CPU usage of a process is very high through the top ranking tool and you need to terminate the running of the process, you can press the k key on the top operation interface, and then "PID to kill" will appear above the list. If prompted, enter the PID number of the specified process according to the prompts and press the enter key to confirm to terminate the corresponding process.
(3) pgrep command
is used to query process PID information based on specific conditions

(4) The pstree command
is used to view the process tree and list the process information in a tree structure

Summary: The above is the entire content of this article, I hope it will be helpful to everyone.
The above is the detailed content of How to view process commands in linux. For more information, please follow other related articles on the PHP Chinese website!

Hot AI Tools

Undresser.AI Undress
AI-powered app for creating realistic nude photos

AI Clothes Remover
Online AI tool for removing clothes from photos.

Undress AI Tool
Undress images for free

Clothoff.io
AI clothes remover

Video Face Swap
Swap faces in any video effortlessly with our completely free AI face swap tool!

Hot Article
Hot Tools

Notepad++7.3.1
Easy-to-use and free code editor

SublimeText3 Chinese version
Chinese version, very easy to use

Zend Studio 13.0.1
Powerful PHP integrated development environment

Dreamweaver CS6
Visual web development tools

SublimeText3 Mac version
God-level code editing software (SublimeText3)
Hot Topics
 1387
1387
 52
52

 Key Linux Operations: A Beginner's Guide
Apr 09, 2025 pm 04:09 PM
Key Linux Operations: A Beginner's Guide
Apr 09, 2025 pm 04:09 PM
Linux beginners should master basic operations such as file management, user management and network configuration. 1) File management: Use mkdir, touch, ls, rm, mv, and CP commands. 2) User management: Use useradd, passwd, userdel, and usermod commands. 3) Network configuration: Use ifconfig, echo, and ufw commands. These operations are the basis of Linux system management, and mastering them can effectively manage the system.
 Where to view the logs of Tigervnc on Debian
Apr 13, 2025 am 07:24 AM
Where to view the logs of Tigervnc on Debian
Apr 13, 2025 am 07:24 AM
In Debian systems, the log files of the Tigervnc server are usually stored in the .vnc folder in the user's home directory. If you run Tigervnc as a specific user, the log file name is usually similar to xf:1.log, where xf:1 represents the username. To view these logs, you can use the following command: cat~/.vnc/xf:1.log Or, you can open the log file using a text editor: nano~/.vnc/xf:1.log Please note that accessing and viewing log files may require root permissions, depending on the security settings of the system.
 How to interpret the output results of Debian Sniffer
Apr 12, 2025 pm 11:00 PM
How to interpret the output results of Debian Sniffer
Apr 12, 2025 pm 11:00 PM
DebianSniffer is a network sniffer tool used to capture and analyze network packet timestamps: displays the time for packet capture, usually in seconds. Source IP address (SourceIP): The network address of the device that sent the packet. Destination IP address (DestinationIP): The network address of the device receiving the data packet. SourcePort: The port number used by the device sending the packet. Destinatio
 How debian readdir integrates with other tools
Apr 13, 2025 am 09:42 AM
How debian readdir integrates with other tools
Apr 13, 2025 am 09:42 AM
The readdir function in the Debian system is a system call used to read directory contents and is often used in C programming. This article will explain how to integrate readdir with other tools to enhance its functionality. Method 1: Combining C language program and pipeline First, write a C program to call the readdir function and output the result: #include#include#include#includeintmain(intargc,char*argv[]){DIR*dir;structdirent*entry;if(argc!=2){
 How to use Debian Apache logs to improve website performance
Apr 12, 2025 pm 11:36 PM
How to use Debian Apache logs to improve website performance
Apr 12, 2025 pm 11:36 PM
This article will explain how to improve website performance by analyzing Apache logs under the Debian system. 1. Log Analysis Basics Apache log records the detailed information of all HTTP requests, including IP address, timestamp, request URL, HTTP method and response code. In Debian systems, these logs are usually located in the /var/log/apache2/access.log and /var/log/apache2/error.log directories. Understanding the log structure is the first step in effective analysis. 2. Log analysis tool You can use a variety of tools to analyze Apache logs: Command line tools: grep, awk, sed and other command line tools.
 How Debian improves Hadoop data processing speed
Apr 13, 2025 am 11:54 AM
How Debian improves Hadoop data processing speed
Apr 13, 2025 am 11:54 AM
This article discusses how to improve Hadoop data processing efficiency on Debian systems. Optimization strategies cover hardware upgrades, operating system parameter adjustments, Hadoop configuration modifications, and the use of efficient algorithms and tools. 1. Hardware resource strengthening ensures that all nodes have consistent hardware configurations, especially paying attention to CPU, memory and network equipment performance. Choosing high-performance hardware components is essential to improve overall processing speed. 2. Operating system tunes file descriptors and network connections: Modify the /etc/security/limits.conf file to increase the upper limit of file descriptors and network connections allowed to be opened at the same time by the system. JVM parameter adjustment: Adjust in hadoop-env.sh file
 How to check Debian OpenSSL configuration
Apr 12, 2025 pm 11:57 PM
How to check Debian OpenSSL configuration
Apr 12, 2025 pm 11:57 PM
This article introduces several methods to check the OpenSSL configuration of the Debian system to help you quickly grasp the security status of the system. 1. Confirm the OpenSSL version First, verify whether OpenSSL has been installed and version information. Enter the following command in the terminal: If opensslversion is not installed, the system will prompt an error. 2. View the configuration file. The main configuration file of OpenSSL is usually located in /etc/ssl/openssl.cnf. You can use a text editor (such as nano) to view: sudonano/etc/ssl/openssl.cnf This file contains important configuration information such as key, certificate path, and encryption algorithm. 3. Utilize OPE
 Debian Mail Server DNS Setup Guide
Apr 13, 2025 am 11:33 AM
Debian Mail Server DNS Setup Guide
Apr 13, 2025 am 11:33 AM
To configure the DNS settings for the Debian mail server, you can follow these steps: Open the network configuration file: Use a text editor (such as vi or nano) to open the network configuration file /etc/network/interfaces. sudonano/etc/network/interfaces Find network interface configuration: Find the network interface to be modified in the configuration file. Normally, the configuration of the Ethernet interface is located in the ifeth0 block.
