Introduction to the method of drawing pie chart with canvas (code)
This article brings you an introduction to the method of drawing a pie chart on canvas (code). It has certain reference value. Friends in need can refer to it. I hope it will be helpful to you.
1. Task Description
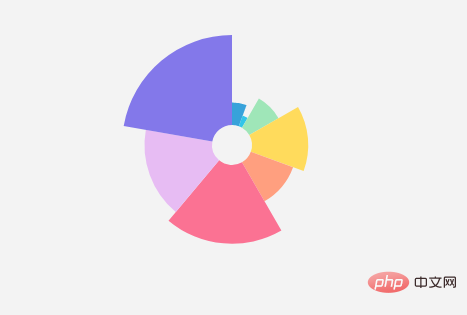
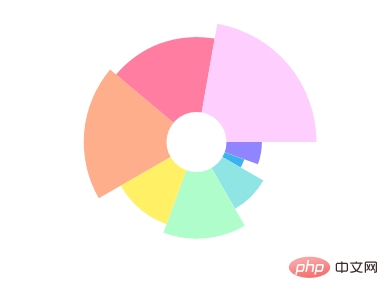
Use the native canvasAPI to draw a pie chart (Nightingale Rose). (Screenshots and data come from Baidu Echarts official sample library [View sample link]).

2. Key Tips
There are many ways to draw Nightingale’s rose diagram. The radius provided in Echarts Or area, two different modes. In this article, the area proportional drawing method is used as an example. The drawing algorithm is as follows:
- Determine the angle of each sector. Since the angles of all sectors add up to 2π, we first calculate the angle according to the data ratio:

- The area of each sector and the total area The ratio between them is the ratio of values. The maximum and minimum values in the given parameter array
options.radiusare used as the drawing data of the sector with the largest value. Substitute into the following formula to obtain the total areaS:

- Use the above formula to calculate the outer circle radius corresponding to each sector, draw the path in canvas and Just fill it.
3. Sample code
Nightingale rose diagram drawing sample code:
//绘制饼图
drawPieChart(options);

/**
 * 绘制饼图
 * @param  {[type]} options [description]
 * @return {[type]}         [description]
 */
function drawPieChart(options) {
   //记录最大数值以反求面积总和
   options.maxValue = 0;
   //求数据集总和以在后续计算每个扇形的角度比例
   options.totalNum = options.data.reduce((pre,cur)=>{
     if (cur.value > options.maxValue) {
         options.maxValue = cur.value;
     }
     return pre+cur.value;
   },0);
    /*以最大值对应最大半径来计算面积总和,并覆盖原值
    *使得最大的一块扇形外圆半径为options.radius[0]
    *内圆半径为options.radius[1]
    */
    let Rmin = options.radius[0];
    let Rmax = options.radius[1];
    let r = Math.sqrt((Rmax*Rmax - Rmin*Rmin)*options.totalNum / options.maxValue + Rmin*Rmin);
    options.radius[1] = r;
    //移动坐标系原点至绘图中心
   let paintingCenter={
     x:parseInt(options.center[0],10)/100 * (options.chartZone[2] - options.chartZone[0]) + options.chartZone[0],
     y:parseInt(options.center[1],10)/100 * (options.chartZone[3] - options.chartZone[1]) + options.chartZone[1]
   }
   context.translate(paintingCenter.x, paintingCenter.y);
    //绘制每个扇形,过程中累加旋转角度
   let allAngle = options.data.reduce((prev,cur,index)=>{
       context.fillStyle = options.colorPool[index]
       let angle = calcPaintingData(cur,options);
       return prev + angle;
   },0);
   //绘制中空白色圆
   context.beginPath();
   context.fillStyle = 'white';
   context.arc(0,0,options.radius[0],0,2*Math.PI,false);
   context.fill();
}

/**
 * 计算每个扇形所需要的绘图参数
 */
function calcPaintingData(data,options) {
    let scale = data.value / options.totalNum;
    let angle = scale * 2 * Math.PI;
    let Rmin = options.radius[0];
    let Rmax = options.radius[1];
    let r = Math.sqrt(scale * (Rmax*Rmax - Rmin*Rmin) + Rmin*Rmin);
    data.r = r;
    //绘制扇形
    paintFan({
        r:r,
        angle:angle,
        data:data,
        options:options
    });
    return angle;//将角度值返回给外层函数以供累加
}

//绘制扇形
function paintFan(opt) {
    context.beginPath();
    context.lineTo(opt.r,0);
    context.arc(0,0,opt.r,0,opt.angle,false);
    context.lineTo(0,0);
    context.closePath();
    context.fill();
    context.rotate(opt.angle);
}The effect can be viewed in the browser:

4. The implementation idea of hover highlighting
- During the drawing process, the drawing data of each sector (radius, starting angle relative to the center of the circle, sector angle) are mounted on the drawing data.
- Listen to the mouse movement event
mousemoveon thecanvastag, and pass the mouse movement eventevent.clientXandin the callback function event.clientYConvert to a numerical value relative to canvas coordinates(mouseX,mouseY). - Connect the circle center coordinates
(paintingCenter.x,paintingCenter.y)to(mouseX,mouseY)as a vector, which can be determined based on the angle and module of the vector Whether the mouse is over a sector. - If it is above the sector, the keyframe will be drawn with transition animation to make the hover effect appear. First modify the
context.fillStylecolor to the highlight color of the corresponding sector, and then increase the outer circle drawing radius to the target size (for example, 10%) in a linear manner frame by frame, using the canvas drawing context in each frame Just re-enclose the drawing area and then fill it. When the hover effect appears, draw the highlighted color drawing area. When the hover effect disappears, just draw the white outer sectors frame by frame starting from the outer circle, and finally draw the data sectors into the original color.
【Related recommendations: HTML5 video tutorial】
The above is the detailed content of Introduction to the method of drawing pie chart with canvas (code). For more information, please follow other related articles on the PHP Chinese website!

Hot AI Tools

Undresser.AI Undress
AI-powered app for creating realistic nude photos

AI Clothes Remover
Online AI tool for removing clothes from photos.

Undress AI Tool
Undress images for free

Clothoff.io
AI clothes remover

AI Hentai Generator
Generate AI Hentai for free.

Hot Article

Hot Tools

Notepad++7.3.1
Easy-to-use and free code editor

SublimeText3 Chinese version
Chinese version, very easy to use

Zend Studio 13.0.1
Powerful PHP integrated development environment

Dreamweaver CS6
Visual web development tools

SublimeText3 Mac version
God-level code editing software (SublimeText3)

Hot Topics
 1378
1378
 52
52
 Which schools use canvas?
Aug 18, 2023 pm 05:59 PM
Schools using canvas include Stanford University, MIT, Columbia University, University of California, Berkeley, etc. Detailed introduction: 1. Stanford University uses Canvas as its main online learning platform. Teachers and students at Stanford University use Canvas to manage and communicate course content, and learn through functions such as online discussions, assignment submissions, and exams; 2. Ma Provincial Polytechnic Institute and MIT also use Canvas as their online learning management system and conduct course management through the Canvas platform; 3. Columbia University, etc.
 What are the canvas arrow plug-ins?
Aug 21, 2023 pm 02:14 PM
The canvas arrow plug-ins include: 1. Fabric.js, which has a simple and easy-to-use API and can create custom arrow effects; 2. Konva.js, which provides the function of drawing arrows and can create various arrow styles; 3. Pixi.js , which provides rich graphics processing functions and can achieve various arrow effects; 4. Two.js, which can easily create and control arrow styles and animations; 5. Arrow.js, which can create various arrow effects; 6. Rough .js, you can create hand-drawn arrows, etc.
 What versions of html2canvas are there?
Aug 22, 2023 pm 05:58 PM
The versions of html2canvas include html2canvas v0.x, html2canvas v1.x, etc. Detailed introduction: 1. html2canvas v0.x, which is an early version of html2canvas. The latest stable version is v0.5.0-alpha1. It is a mature version that has been widely used and verified in many projects; 2. html2canvas v1.x, this is a new version of html2canvas.
 What are the details of the canvas clock?
Aug 21, 2023 pm 05:07 PM
The details of the canvas clock include clock appearance, tick marks, digital clock, hour, minute and second hands, center point, animation effects, other styles, etc. Detailed introduction: 1. Clock appearance, you can use Canvas to draw a circular dial as the appearance of the clock, and you can set the size, color, border and other styles of the dial; 2. Scale lines, draw scale lines on the dial to represent hours or minutes. Position; 3. Digital clock, you can draw a digital clock on the dial to indicate the current hour and minute; 4. Hour hand, minute hand, second hand, etc.
 What properties does tkinter canvas have?
Aug 21, 2023 pm 05:46 PM
The tkinter canvas attributes include bg, bd, relief, width, height, cursor, highlightbackground, highlightcolor, highlightthickness, insertbackground, insertwidth, selectbackground, selectforeground, xscrollcommand attributes, etc. Detailed introduction
 uniapp implements how to use canvas to draw charts and animation effects
Oct 18, 2023 am 10:42 AM
How to use canvas to draw charts and animation effects in uniapp requires specific code examples 1. Introduction With the popularity of mobile devices, more and more applications need to display various charts and animation effects on the mobile terminal. As a cross-platform development framework based on Vue.js, uniapp provides the ability to use canvas to draw charts and animation effects. This article will introduce how uniapp uses canvas to achieve chart and animation effects, and give specific code examples. 2. canvas
 Learn the canvas framework and explain the commonly used canvas framework in detail
Jan 17, 2024 am 11:03 AM
Explore the Canvas framework: To understand what are the commonly used Canvas frameworks, specific code examples are required. Introduction: Canvas is a drawing API provided in HTML5, through which we can achieve rich graphics and animation effects. In order to improve the efficiency and convenience of drawing, many developers have developed different Canvas frameworks. This article will introduce some commonly used Canvas frameworks and provide specific code examples to help readers gain a deeper understanding of how to use these frameworks. 1. EaselJS framework Ea
 Explore the powerful role and application of canvas in game development
Jan 17, 2024 am 11:00 AM
Understand the power and application of canvas in game development Overview: With the rapid development of Internet technology, web games are becoming more and more popular among players. As an important part of web game development, canvas technology has gradually emerged in game development, showing its powerful power and application. This article will introduce the potential of canvas in game development and demonstrate its application through specific code examples. 1. Introduction to canvas technology Canvas is a new element in HTML5, which allows us to use


