How to use debug in c language
Simply speaking, there are two ways. One is source code debugging, which is to analyze the source code to find the bug location. Generally, printf() is used to print out the information of each step of program execution. The other is To debug executable files, you need to use a debugger.
1. Source code debug
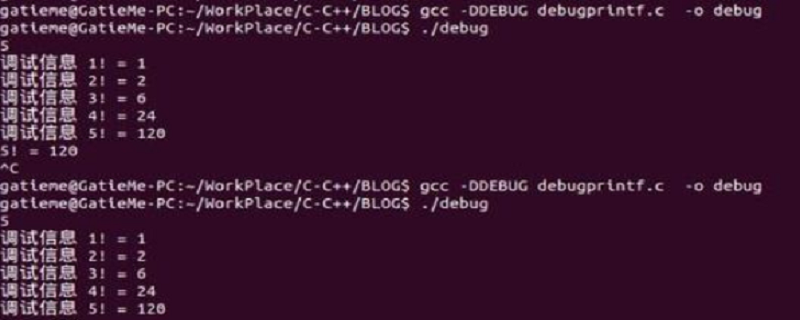
is similar to the source code below. It mainly uses the information output when the program is executed to locate the location of the bug, and then modify it. Source code.
#include <stdio.h>
void f() { ; }
int main()
{
#ifdef _DEBUG
    printf("start main function!\n");
#endif
    void f();
#ifdef _DEBUG
    printf("leave main function !\n");
#endif
    return 0;
}Another case of using debug in C language
# 在代码中写入
#ifdef  DEBUG
#endif
# 编译时用 gcc –DDEBUG –g –o ***  ***.c  此时运行的结果是有debug信息的 ,gcc –o ***  ***.c  无debug 信息 ,如
# include <stdio.h>
int main ()
{    int i=0 ;
    while (1) {
  printf ("hello world\t") ;
        i++ ;
    printf ("time=%d\n",i);
#ifdef DEBUG
     if (i>10)
         break ;
#endif
    }
       return 0 ;
}Open debug: gcc -DDEBUG -o debug debug.c
No need to debug (infinite loop): gcc - o debug debug.c
2. For executable file debugging, the commonly used debugging on the Windows platform is the debugging that comes with vs/vc. The other is the debugger windbg developed by Microsoft. gdb is commonly used on Linux platforms.
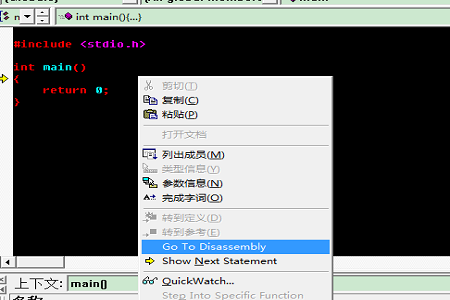
The debugger that comes with the IDE takes VC6.0 as an example. After writing the code, press F11 on the shortcut keyboard to enter debugging. At this time, right-click and select "go to disassembly" to view the program. disassembly code. Generally, in this case, it is mainly for learning disassembly of C language.
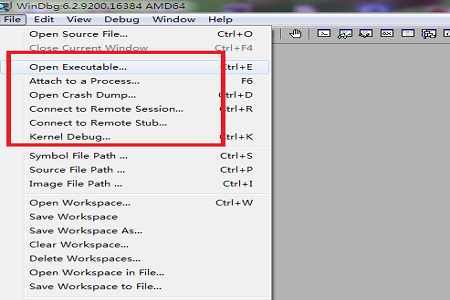
Windbg has many functions. It can debug source code, debug executable files, kernel debugging, and debug dump files. The more you use it, the more natural it will be. Familiar, to debug an executable file, just click "File", select "Open Executeable" in the pop-up dialog box, and then find the program you want to debug.
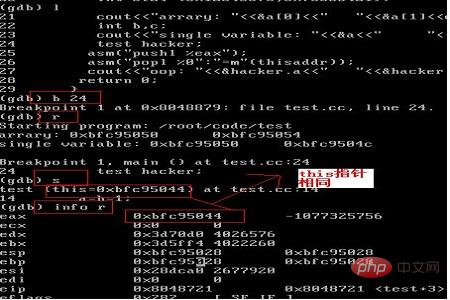
The Gdb debugger is commonly used in Linux. It is worth noting that to use gdb debugging, when using gcc or g to compile C/c files, you need to add the -g parameter. Only then can the symbol table be generated. The picture below is a screenshot of using gdb to analyze the distribution of variables in C. Let’s take a general look at what it looks like. You will become familiar with it after using it a lot, and you don’t need to learn it.
The above is the detailed content of How to use debug in c language. For more information, please follow other related articles on the PHP Chinese website!

Hot AI Tools

Undresser.AI Undress
AI-powered app for creating realistic nude photos

AI Clothes Remover
Online AI tool for removing clothes from photos.

Undress AI Tool
Undress images for free

Clothoff.io
AI clothes remover

AI Hentai Generator
Generate AI Hentai for free.

Hot Article

Hot Tools

Notepad++7.3.1
Easy-to-use and free code editor

SublimeText3 Chinese version
Chinese version, very easy to use

Zend Studio 13.0.1
Powerful PHP integrated development environment

Dreamweaver CS6
Visual web development tools

SublimeText3 Mac version
God-level code editing software (SublimeText3)

Hot Topics
 1376
1376
 52
52
 What are constants in C language? Can you give an example?
Aug 28, 2023 pm 10:45 PM
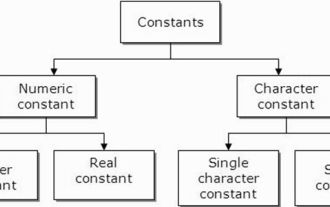
A constant is also called a variable and once defined, its value does not change during the execution of the program. Therefore, we can declare a variable as a constant referencing a fixed value. It is also called text. Constants must be defined using the Const keyword. Syntax The syntax of constants used in C programming language is as follows - consttypeVariableName; (or) consttype*VariableName; Different types of constants The different types of constants used in C programming language are as follows: Integer constants - For example: 1,0,34, 4567 Floating point constants - Example: 0.0, 156.89, 23.456 Octal and Hexadecimal constants - Example: Hex: 0x2a, 0xaa.. Octal
 VSCode and VS C++ IntelliSense not working or picking up libraries
Feb 29, 2024 pm 01:28 PM
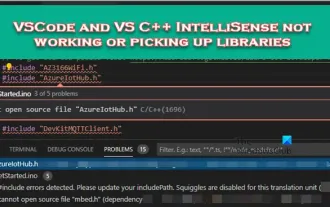
VS Code and Visual Studio C++ IntelliSense may not be able to pick up libraries, especially when working on large projects. When we hover over #Include<wx/wx.h>, we see the error message "CannotOpen source file 'string.h'" (depends on "wx/wx.h") and sometimes, autocomplete Function is unresponsive. In this article we will see what you can do if VSCode and VSC++ IntelliSense are not working or extracting libraries. Why doesn't my Intellisense work in C++? When working with large files, IntelliSense sometimes
 How to solve the problem of invalid debugging when setting breakpoints in SpringBoot project
May 11, 2023 am 10:49 AM
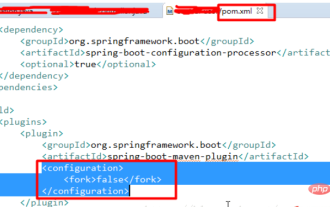
I am new to the springboot project. (1) I found that breakpoint debugging was ineffective. I was very depressed and searched for solutions online. All I saw were some very complicated solutions, which were said to be remote debugging, but also required additional opening slogans. This is different from a traditional project, so I don’t think it’s necessary. So after some exploration, I found that there is a simpler way. The steps are as follows: Add a configuration in the plugin part of the pom file: false and it will be ok; (2) Regarding the error in the SpringBoot project that the web.xml file is missing, because Traditional web projects require web.xml files, but SpringBoot projects do not require web.xml files.
 Fix Xbox error code 8C230002
Feb 27, 2024 pm 03:55 PM
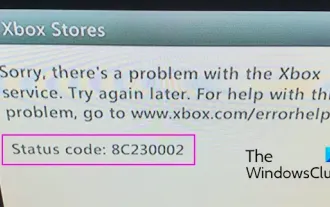
Are you unable to purchase or watch content on your Xbox due to error code 8C230002? Some users keep getting this error when trying to purchase or watch content on their console. Sorry, there's a problem with the Xbox service. Try again later. For help with this issue, visit www.xbox.com/errorhelp. Status Code: 8C230002 This error code is usually caused by temporary server or network problems. However, there may be other reasons, such as your account's privacy settings or parental controls, that may prevent you from purchasing or viewing specific content. Fix Xbox Error Code 8C230002 If you receive error code 8C when trying to watch or purchase content on your Xbox console
 Recursive program to find minimum and maximum elements of array in C++
Aug 31, 2023 pm 07:37 PM
We take the integer array Arr[] as input. The goal is to find the largest and smallest elements in an array using a recursive method. Since we are using recursion, we will iterate through the entire array until we reach length = 1 and then return A[0], which forms the base case. Otherwise, the current element is compared to the current minimum or maximum value and its value is updated recursively for subsequent elements. Let’s look at various input and output scenarios for this −Input −Arr={12,67,99,76,32}; Output −Maximum value in the array: 99 Explanation &mi
 China Eastern Airlines announces that C919 passenger aircraft will soon be put into actual operation
May 28, 2023 pm 11:43 PM
According to news on May 25, China Eastern Airlines disclosed the latest progress on the C919 passenger aircraft at the performance briefing meeting. According to the company, the C919 purchase agreement signed with COMAC has officially come into effect in March 2021, and the first C919 aircraft has been delivered by the end of 2022. It is expected that the aircraft will be officially put into actual operation soon. China Eastern Airlines will use Shanghai as its main base for commercial operations of the C919, and plans to introduce a total of five C919 passenger aircraft in 2022 and 2023. The company stated that future introduction plans will be determined based on actual operating conditions and route network planning. According to the editor's understanding, the C919 is China's new generation of single-aisle mainline passenger aircraft with completely independent intellectual property rights in the world, and it complies with internationally accepted airworthiness standards. Should
 C++ program to print spiral pattern of numbers
Sep 05, 2023 pm 06:25 PM
Displaying numbers in different formats is one of the basic coding problems of learning. Different coding concepts like conditional statements and loop statements. There are different programs in which we use special characters like asterisks to print triangles or squares. In this article, we will print numbers in spiral form, just like squares in C++. We take the number of rows n as input and start from the top left corner and move to the right, then down, then left, then up, then right again, and so on and so on. Spiral pattern with numbers 123456724252627282982340414243309223948494431102138474645321120373635343312191817161514
 For the first time in 23 years, C# wins the TIOBE 2023 Programming Language of the Year Award
Jan 11, 2024 pm 04:45 PM
According to the TIOBE Programming Community Index, one of the benchmarks for measuring the popularity of programming languages, it is evaluated by collecting data from engineers, courses, vendors and search engines around the world. The TIOBE Index in January 2024 was released recently, and the official programming language rankings for 2023 were announced. C# won the TIOBE 2023 Programming Language of the Year. This is the first time that C# has won this honor in 23 years. TIOBE's official press release stated that C# has been in the top 10 for more than 20 years. Now it is catching up with the four major languages and has become the programming language with the largest growth in one year (+1.43%). It well-deserved to win this award. Ranked second are Scratch (+0.83%) and Fortran (+0


