
1. Server (linux centos) install xdebug
pecl install xdebug
Note that after the installation is completed, the path to debug.so will be displayed and record it
2. Configure php.ini
If you don’t know where php.ini is, you can search it
find / -name "php.ini"
Add xdebug configuration
zend_extension="/usr/local/php/lib/php/extensions/no-debug-non-zts-20170718/xdebug.so"xdebug.remote_enable = 1xdebug.remote_host = 使用PhpStorm的那个机器的公网ip,可在(https://ip.cn/)查xdebug.remote_connect_back = 1xdebug.remote_port = 9001xdebug.idekey="PHPSTORM"
Restart php-fpm.
3. Use phpinfo(); to verify whether the xdebug extension is installed successfully. If the installation is successful, you can see the following picture
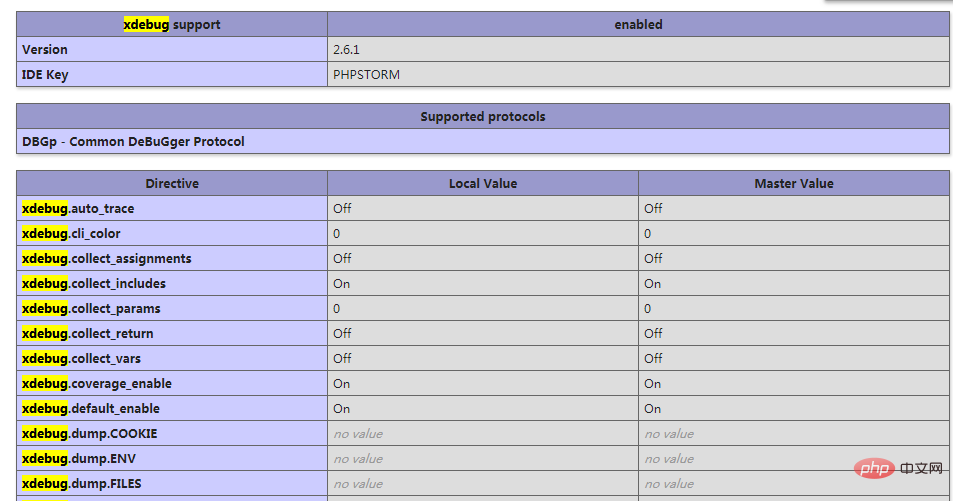
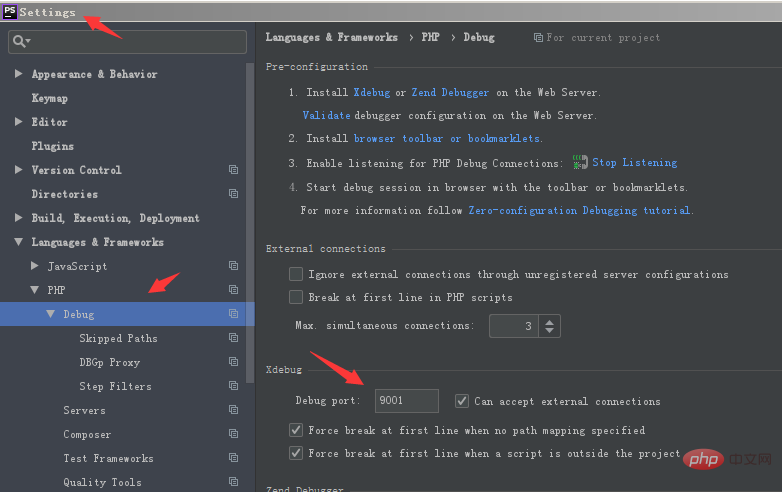
##4. Set the debug port, which is consistent with the 2. configuration (xdebug.remote_port)
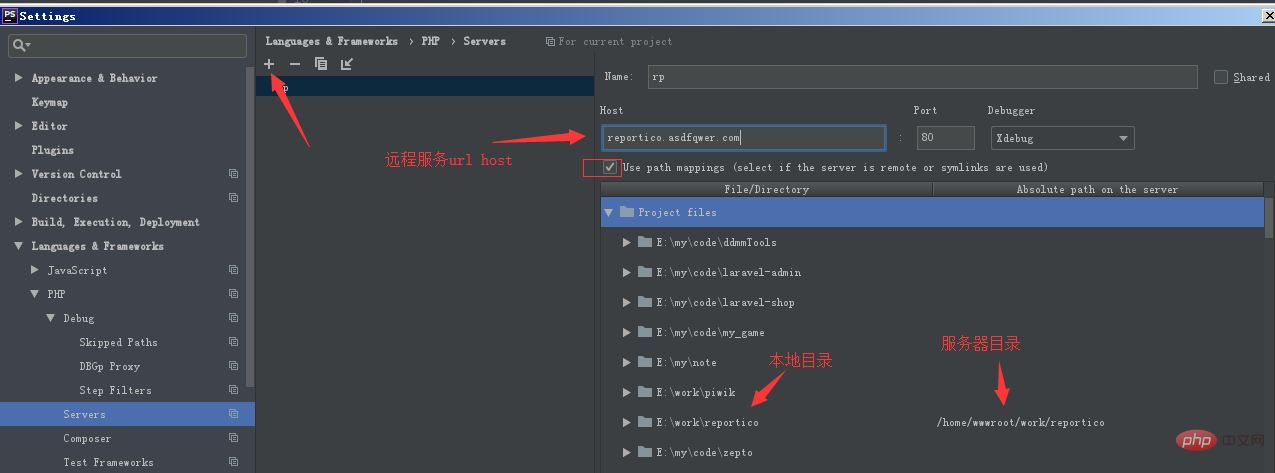
5. Set Servers in PhpStorm
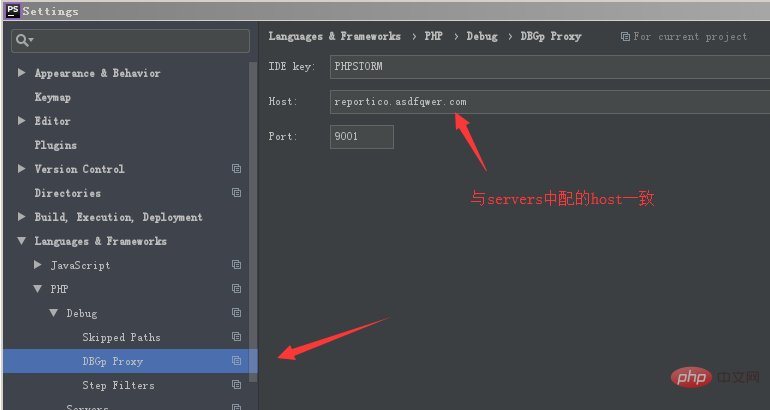
6. Set up DBGp proxy
7. Install the Chrome xdebug extension (may open a proxy) to facilitate remote debugging.
https://chrome.google.com/extensions/detail/eadndfjplgieldjbigjakmdgkmoaaaoc
and click option

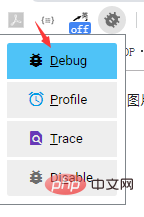
, select Debug, and open debug Switch (you may need to open the page that needs to be debugged first)

10. Open PhpStorm's monitoring (upper right corner)

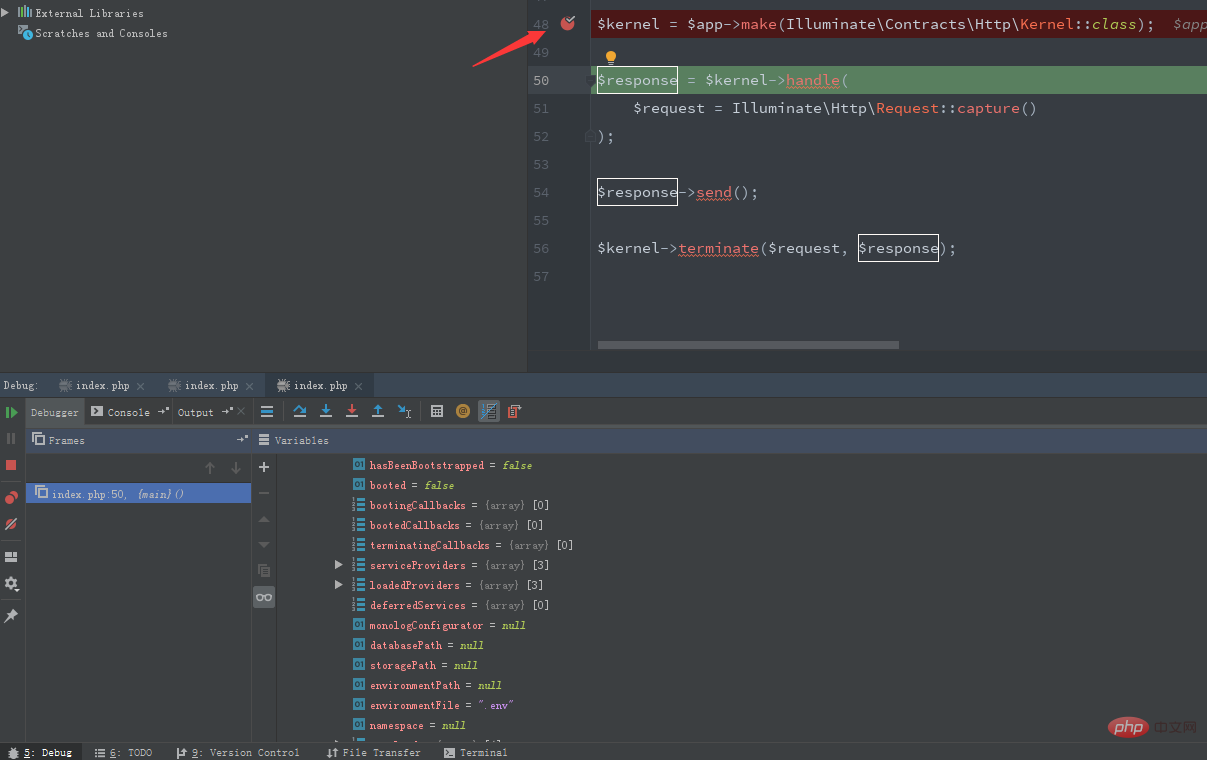
F8 - Step over. Continue to execute the program after the breakpoint, execute line by line, execute one line at a time
F7 - step. Enter the content program executed at the breakpointALT F9 - Run to the cursor
F9 Continue to execute the program after the breakpoint and stop at the next breakpoint
The above is the detailed content of PHP Xdebug + PhpStorm debugging remote server code. For more information, please follow other related articles on the PHP Chinese website!