Matplotlib is a Python 2D plotting library that can generate publication-quality graphics in a variety of hardcopy formats and interactive environments on a variety of platforms.

In the previous article, I talked about how to fill the color and lines of graphics, and today I will show you how to use matplotlib to create 3D graphics. . I have tried a variety of 2D graphics before, and I believe everyone will be interested in 3D graphics.
Matplotlib already has three-dimensional graphics built-in, so we don’t need to download anything. First, we need to bring in some complete modules:
from mpl_toolkits.mplot3d import axes3d
import matplotlib.pyplot as plt
Axes3d is used because it requires different kinds of axes in order to actually draw something in three dimensions. Below:
fig = plt.figure()
ax1 = fig.add_subplot(111, projection='3d')
Here we define the figure as usual, and then we define ax1 as the usual subfigure, only this time using a 3D projection. We need to do this to remind Matplotlib that we are providing three-dimensional data.
Now let’s create some 3D data:
x = [1,2,3,4,5,6,7,8,9,10]
y = [5,6,7,8,2,5,6,3,7,2]
z = [1,2,6,3,2,7,3,3,7,2]
Next, we plot it. First, let's show a simple wireframe example:
ax1.plot_wireframe(x,y,z)
Finally:
ax1.set_xlabel('x axis')
ax1.set_ylabel('y axis')
ax1.set_zlabel('z axis')
plt.show()
Our complete code is:
from mpl_toolkits.mplot3d import axes3d
import matplotlib.pyplot as plt
from matplotlib import style
style.use('fivethirtyeight')
fig = plt.figure()
ax1 = fig.add_subplot(111, projection='3d')
x = [1,2,3,4,5,6,7,8,9,10]
y = [5,6,7,8,2,5,6,3,7,2]
z = [1,2,6,3,2,7,3,3,7,2]
ax1.plot_wireframe(x,y,z)
ax1.set_xlabel('x axis')
ax1.set_ylabel('y axis')
ax1.set_zlabel('z axis')
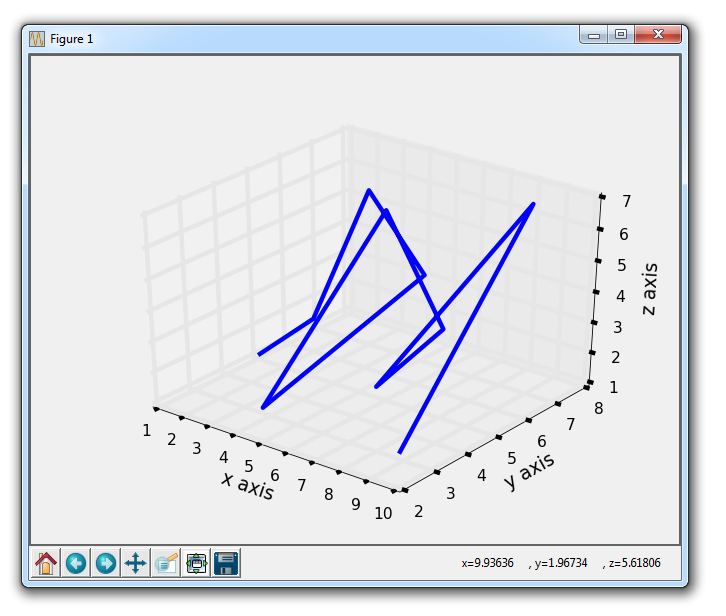
plt.show()The result is (including styles used):

Summary
These 3D graphics can be interacted with. First, you can move the graphic by clicking and dragging with the left mouse button. You can also use the right mouse button to click and drag to zoom in or out.
The above is the detailed content of How to draw 3D graphics with Matplotlib. For more information, please follow other related articles on the PHP Chinese website!