

##Business background
Framework and corresponding Environment
php has enabled opcache, laravel has also run the optimize command for optimization, and composer has also run the dump-autoload command.
The first thing to declare is that there must be minor problems in the system environment ( It is impossible to improve such a large performance without problems), but these problems, if you do not use appropriate tools, may not be discovered in your lifetime.
This article focuses on how to discover these problems, and how to find them The idea.
We first find a suitable API or function in the system to amplify the problem.
This API was originally designed to do health checks for nginx load balancing. Use ab -n 100000 -c 1000 for stress testing and find that the qps can only reach 140 times per second.
We know that Laravel's performance is notoriously bad, but it is not to this extent. It seems that the api should not be so low. So I decided to find out.
 public function getActivateStatus()
    {
        try {
            $result = \DB::select('select 1');
            $key = 1;
            if ($result[0]->$key !== 1) {
                throw new \Exception("mysql 检查失败");
            }
        } catch (\Exception $exception) {
            \Log::critical("数据库连接失败: {$exception->getMessage()}", $exception->getTrace());
            return \response(null, 500);
        }
        try {
            Cache::getRedis()->connection()->exists("1");
        } catch (\Exception $exception) {
            \Log::critical("缓存连接失败: {$exception->getMessage()}", $exception->getTrace());
            return \response(null, 500);
        }
        return \response(null, 204);
}Problem manifestations and troubleshooting ideas
top
The top command found that the system CPU occupied 100% Among them, user mode accounts for 80% and kernel mode accounts for 20%. It seems that there is no big problem. There is one place that looks strange. The result of running the top command
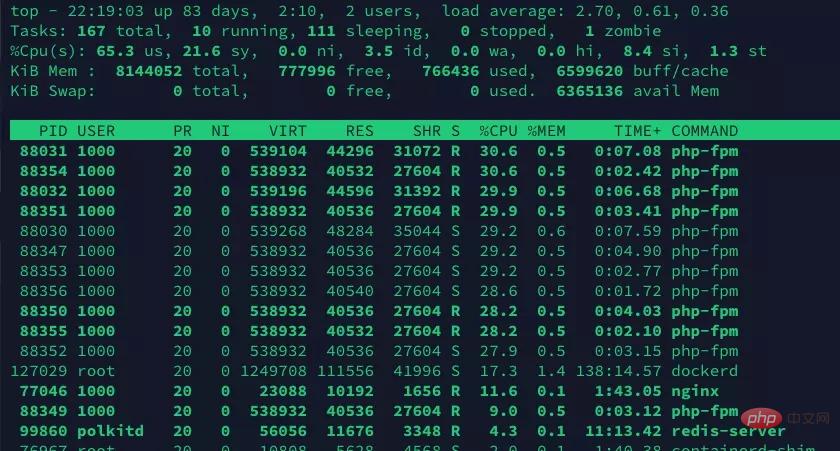 # is that part of the php-fpm process is in Sleep state, but the CPU usage still reaches nearly 30%.
When a process is in Sleep state, it still occupies a lot of CPU. Don't doubt whether it is a problem with the process. Let's take a look at the man page of the Ttop command.
%CPU -- CPU usage

The task's share of the elapsed CPU time since the last screen update, expressed as a percentage of total CPU time.
roughly means that this occupation is the last time When the screen is refreshed, the process CPU is occupied. Since the top command collects information, Linux may forcefully schedule the process (for example, it is used to collect process information with top), so at this moment (the moment the screen is refreshed) a certain Some php-fpm processes are in sleep state, which is understandable, so it should not be a problem with php-fpm.
pidstatFirst select a php-fpm process, and then Use pidstat to check the detailed running status of the process
Nothing unusual was found during the process, and the running results are basically the same as the top command.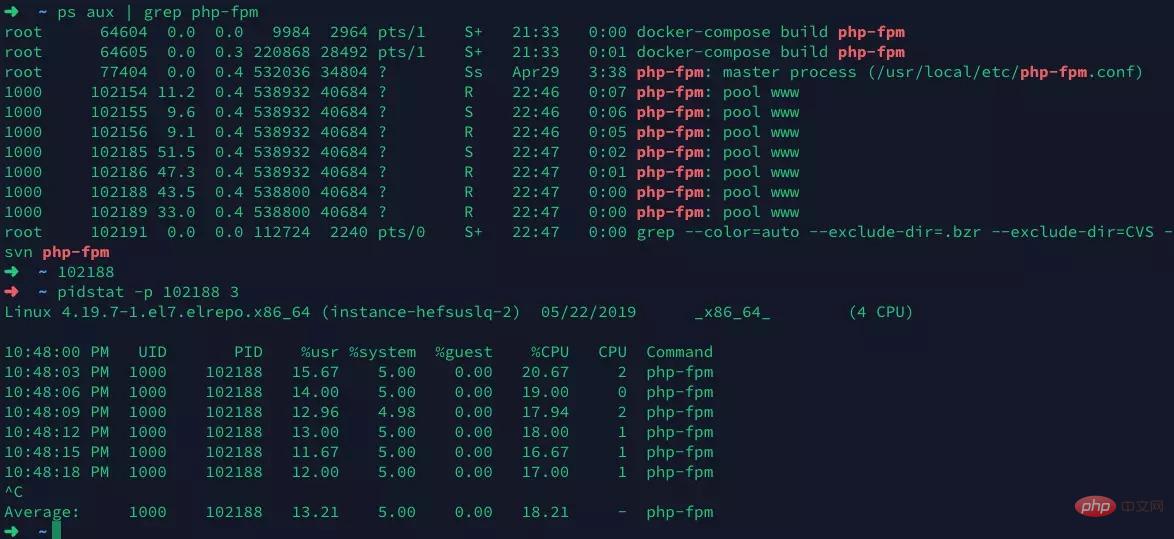
Keep the stress test pressure and run vmstate to check. Except for the context switch (context switch) which is a bit high, I don't see many abnormalities. Since the docker, redis, and mysql we use are all running on the same machine, a CS of about 7,000 is still a reasonable range, but the IN (interruption) is a bit too high, reaching about 14,000. There must be something triggering it Interrupt.
 We know that interrupts include hard interrupts and soft interrupts. Hard interrupts are interrupt signals sent by hardware such as network cards and mice, and the CPU immediately stops what it is doing. Process interrupt signals. Soft interrupts are issued by the operating system and are often used for forced scheduling of processes.
Both vmstat and pidstat are only new performance detection tools. We cannot see who issued the specific interrupt. . We read the system's interrupt information from the read-only file /proc/interrupts to get what exactly caused the increase in interrupts. Use the watch -d command to determine the most frequently changing interrupts.
watch -d cat /proc/interrupts
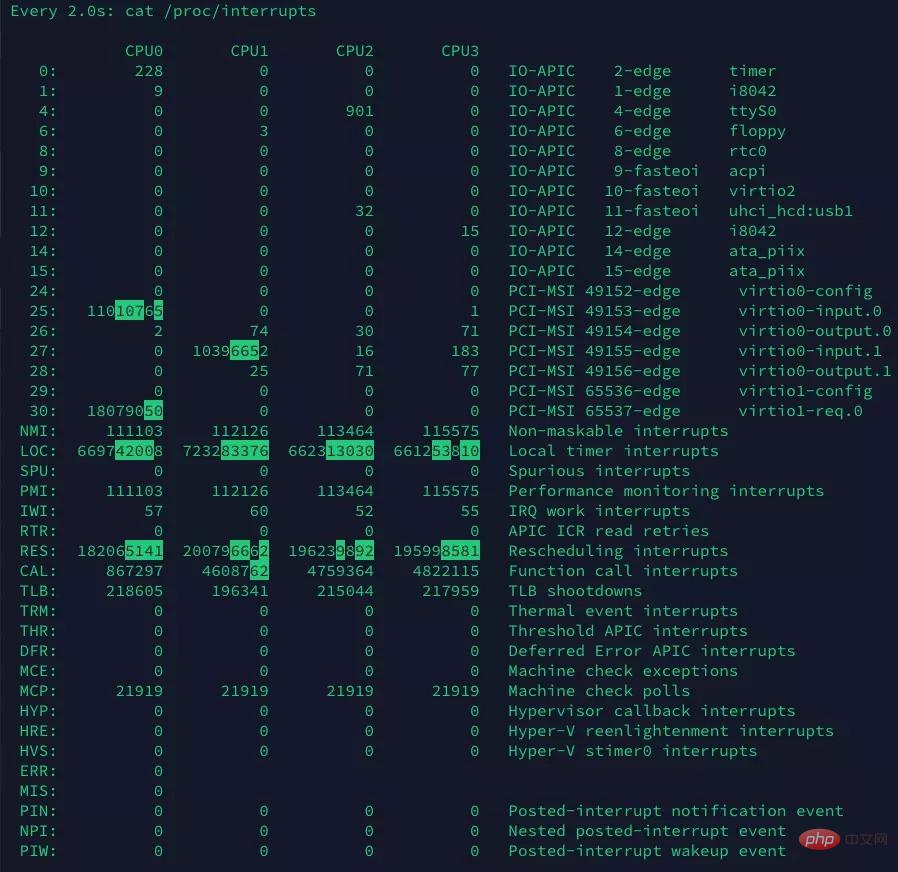 We found that Rescheduling interrupts change the fastest among them. This is the rescheduling interrupt (RES). This interrupt type means to wake up the idle CPU to schedule new tasks to run. This is the mechanism used by the scheduler to distribute tasks to different CPUs in multi-processor systems (SMP). It is also commonly called Inter-Processor Interrupts (IPI).
Combining the commands in vmstat, we can determine that one of the reasons for low qps is caused by too many processes competing for the CPU. We are not sure what it is yet, so further investigation is needed.
strace
strace can view system calls. We know that when using system calls, the system falls into kernel mode. This process will generate soft interrupts. By viewing the php-fpm system Call, verify our conjecture
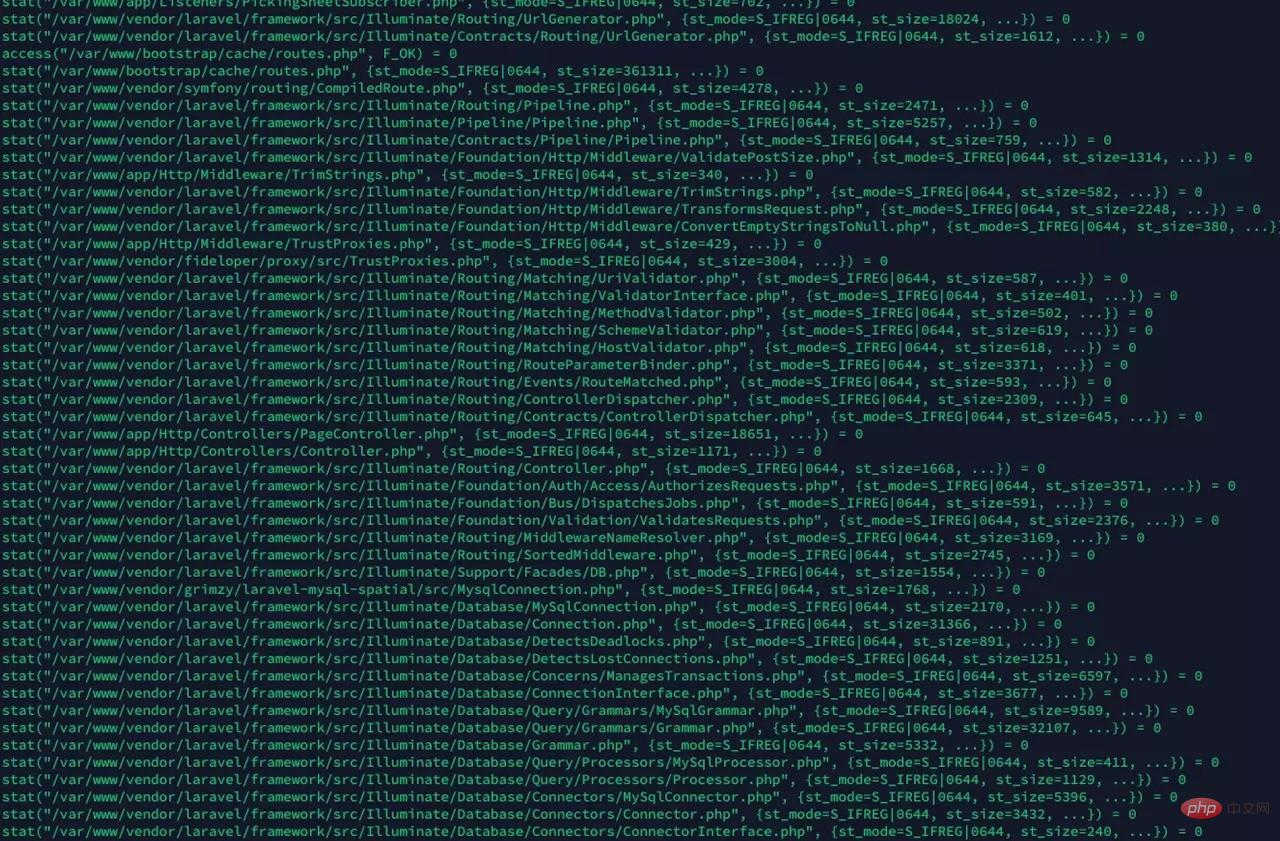 果然, 发现大量的stat系统调用, 我们猜想, 是opcache在检查文件是否过期导致的. 我们通过修改opcache的配置, 让opcache更少的检查文件timestamp, 减少这种系统调用
 opcache.validate_timestamps="60"
opcache.revalidate_freq="0"再次执行ab命令进行压测
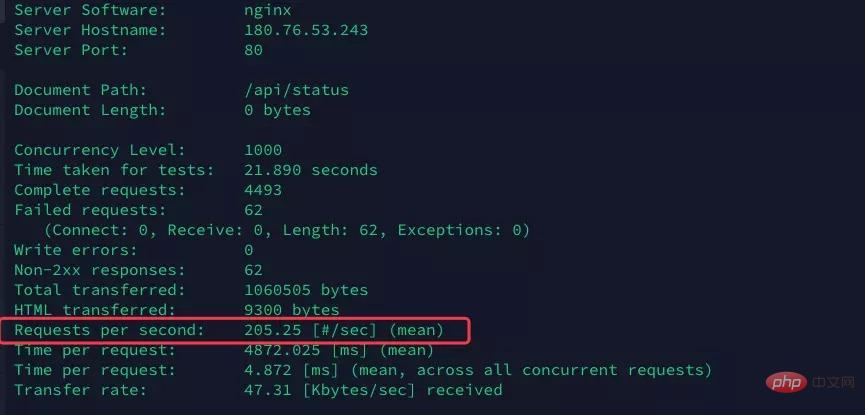 果然qps直接涨到了205, 提升非常明显, 有接近 46% 的提升
perf
现在任然不满足这个性能, 希望在更多地方找到突破口. 通过
perf record -g
perf report -g
看到系统的分析报告
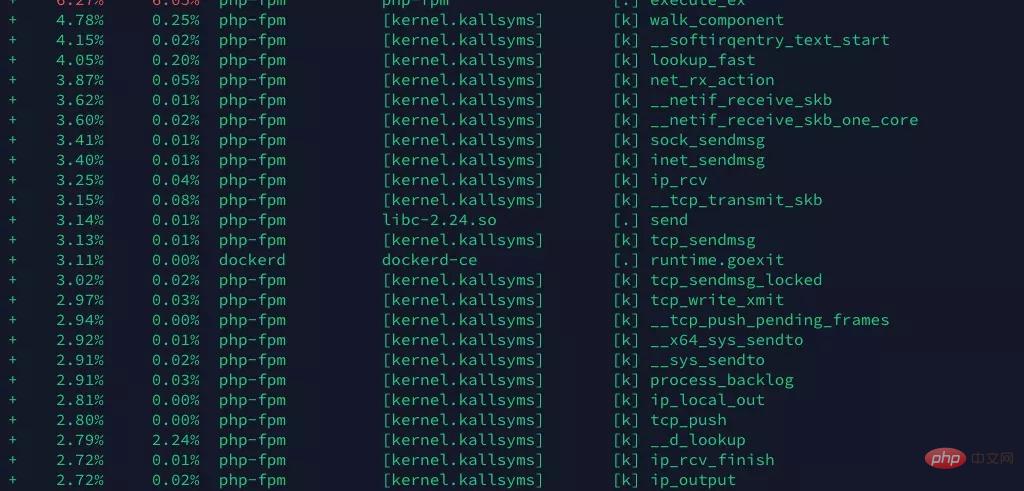
我们看到, 好像这里面有太多tcp建立相关的系统调用(具体是不是我还不清楚, 请大神指正, 但是看到send, ip, tcp啥的我就怀疑可能是tcp/ip相关的问题).
我们怀疑两种情况
与mysql, redis重复大量的建立TCP连接, 消耗资源
大量请求带来的tcp连接
先说第一个, 经过检查, 发现数据库连接使用了php-fpm的连接池, 但是redis连接没有, redis用的predis, 这个是一个纯PHP实现, 性能不高, 换成了phpredis:
打开laravel的config/database.php文件, 修改redis的driver为phpredis, 确保本机已安装php的redis扩展. 另外由于Laravel自己封装了一个Redis门面, 而恰好redis扩展带来的对象名也叫Redis. 所以需要修改Laravel的Redis门面为其他名字, 如RedisL5.
再次进行压测
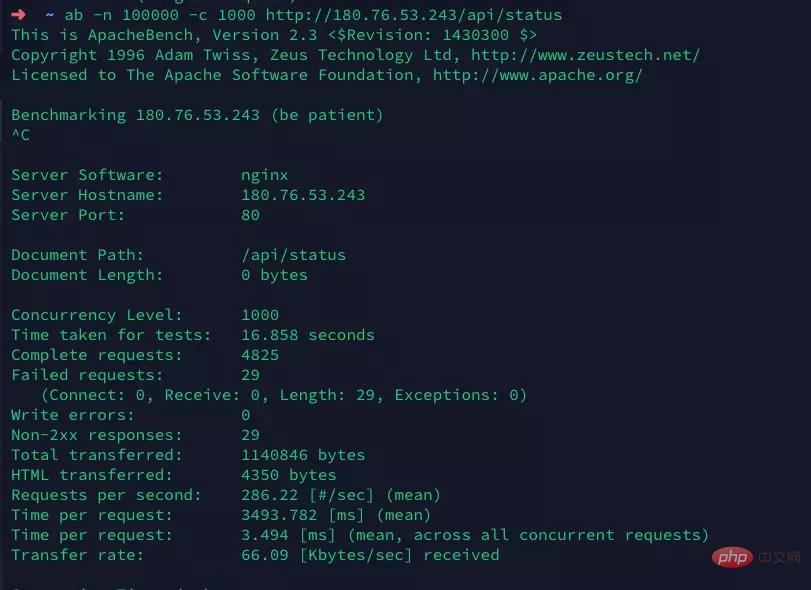
达到了喜人的286qps, 虽然和其他主打高性能的框架或者原生php比, 还有很高的提升空间(比如Swoole), 但是最终达到了104%的提升, 还是很有意义的
总结
我们通过top, 发现系统CPU占用高, 且发现确实是php-fpm进程占用了CPU资源, 判断系统瓶颈来自于PHP.
接着我们通过pidstat, vmstat发现压测过程中, 出现了大量的系统中断, 并通过 watch -d cat /proc/interrupts 发现主要的中断来自于重调度中断(RES)
通过strace查看具体的系统调用, 发现大量的系统调用来自于stat, 猜测可能是opcache频繁的检查时间戳, 判断文件修改. 通过修改配置项, 达到了46%的性能提升
最后再通过perf, 查看函数调用栈, 分析得到, 可能是大量的与redis的TCP连接带来不必要的资源消耗. 通过安装redis扩展, 以及使用phpredis来驱动Laravel的redis缓存, 提升性能, 达到了又一次近50%的性能提升.
最终我们完成了我们的性能提升104%的目标
推荐教程:网站高并发架设基础教程
The above is the detailed content of PHP concurrency performance tuning practice (performance increased by 104%). For more information, please follow other related articles on the PHP Chinese website!