Can python be used to trade stocks?
Python is a language widely used in various industries, including computers, biology, and finance. It can be said that python can do everything except not having children. This article will use Python to play with stock data and let you see the power of Python.

Tools used
python3.6Juypter notebook (interactive IDE, recommended) numpy, pandas for data analysis matplotlib, seaborn are used for data visualization pandas_datareader is used to obtain stock data
Data acquisition
We can obtain stock data from pandas_datareader. First you need to install this library
Related recommendations: "python video tutorial"
pip install pandas
pip install pandas-datareader
Then you can access the data
from pandas_datareader.data import DataReader
datas = DataReader(name='BABA', data_source='yahoo', start='2015-01-01', end='2018-01-01')
Here, I first Save the data as a csv file, let's first look at Alibaba's stock data in previous years.
import pandas as pd
file = 'BABA.csv'   #csv文件index = 'Date'      #将日期作为索引列alibaba = pd.read_csv(file, index_col=index)    #读取csv文件数据
Then let’s simply check Alibaba’s stock data
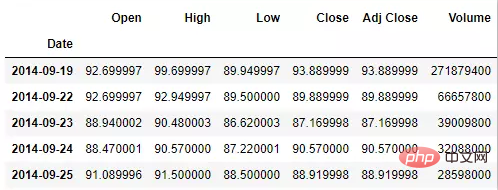
alibaba.head(n = 5) #查看前5行数据
The following are the first 5 rows of stock data. We can see the opening price, closing price, highest value, and lowest value of each day. value, trading volume, etc.
#Then look at the description of the data to get an intuitive feel for the data.
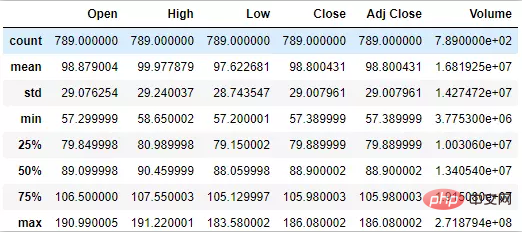
alibaba.describe()
This is some analysis of the statistics of the data. You can see that there are a total of 789 rows of data, and the highest and lowest values are not much different.
Historical trend analysis
Before analysis, we first import the required Python scientific computing library.
# 数据分析
import numpy as np
import pandas as pd
from pandas import Series, DataFrame# 可视化
import matplotlib.pyplot as plt
import seaborn as sns
%matplotlib inline
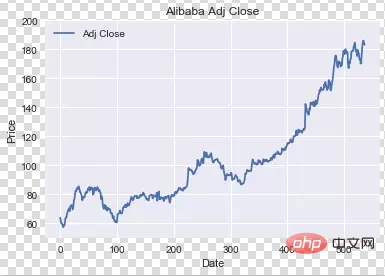
We first analyze the overall trend of the stock's closing price.
alibaba['Adj Close'].plot(legend = True)
plt.title('Alibaba Adj Close')
plt.ylim([50,200])
plt.xlabel('Date')
plt.ylabel('Price')
It can be seen that although there are small fluctuations in the middle, the overall trend of the closing price is upward, which shows that Alibaba's market value has been rising.
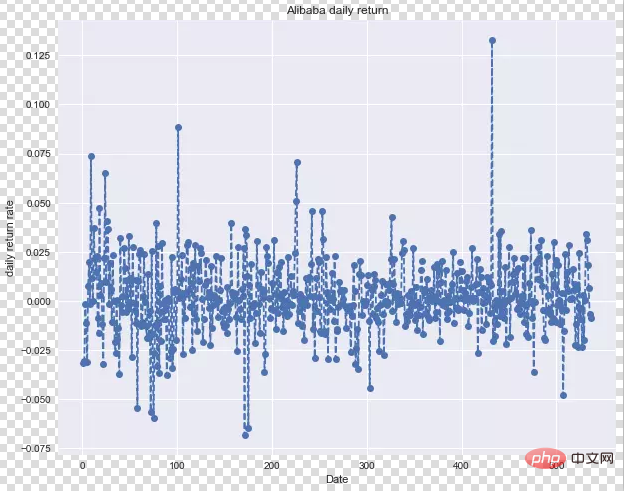
Then let’s take a look at the daily rate of return of Alibaba stocks. After all, making money in the stock market mainly relies on the profits from buying low and selling high.
size = (10,8)
alibaba['daily-return'].plot(figsize = size,linestyle = '--',marker = 'o') #折线图,原点表示最大最小点plt.title('Alibaba daily return')
plt.xlabel('Date')
plt.ylabel('daily return rate')
The daily rate of return is not stable, which proves that the stock market is risky and needs to be treated with caution.
Practical Tips: The pct_change() function compares each element to its previous element and calculates the percentage change. By default, pct_change() operates on columns; if you want to apply it on rows, use the axis = 1 parameter.
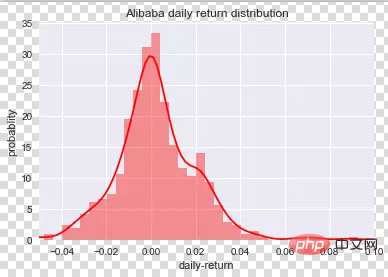
Let’s use density plots and histograms to check the overall situation of daily returns.
data = alibaba['daily-return'].dropna() #清除异常值bins = 50 #分为50个区间#在同一张图上画出分布直方图和密度图sns.distplot(data, bins  = bins, color = 'red',hist = True, kde = True)
plt.title('Alibaba daily return distribution')
plt.xlabel('daily-return')
plt.ylabel('probablity')
plt.xlim([-0.05,0.1])
We can see from the figure that the overall rate of return is basically stable at around 0, and the profit or loss is symmetrical.
Risk Analysis
In the risk analysis, we compare several large companies in the Internet industry to see what their stocks have What's the difference? The five companies I chose here are Apple, Google, Amazon, Microsoft, and Facebook, and the time is from 2015 to 2017. (You can also get it from the previous link in Baidu Netdisk.)
Read the top5.csv file to get the data, sort by time, and view it.
file = "top5.csv"index = 'Date'top_tech_df = pd.read_csv(file,index_col = index)  #读取数据
top_tech_df=top_tech_df.sort_index()    #按索引,也就是时间排序
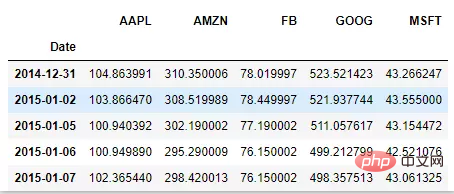
top_tech_df.head(n = 5)
The data here refers to the closing price of the stock, which is the first 5 pieces of data.
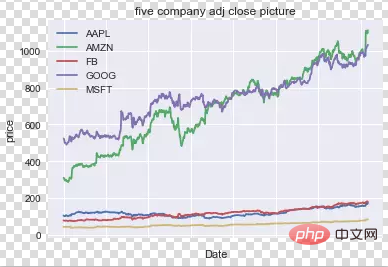
First, let’s comprehensively compare these 5 companies to see who is more powerful.
top_tech_df.plot(kind = 'line')      #折线图plt.title('five company adj close picture')
plt.xlabel('Date')
plt.ylabel('price')
plt.legend()     #添加图例
It can be seen that the closing prices of Google and Amazon are always higher than those of the other three companies, and these two companies also seem to be somewhat related. If you go up, I will go up, and if you go down, I will go down.
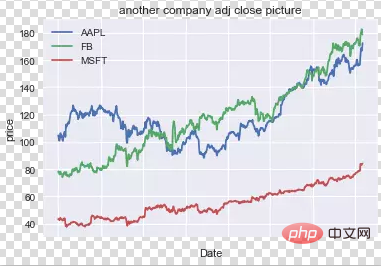
In the picture above, we can see that the other three companies seem to be developing steadily. In fact, due to the large scale of the picture, it is relatively flat. The real situation is actually one after another, and there are also big differences. Fluctuations, check it out below.
another_company = ['AAPL','FB','MSFT']
top_tech_df[another_company].plot()
plt.title('another company adj close picture')
plt.xlabel('Date')
plt.ylabel('price')
plt.legend()
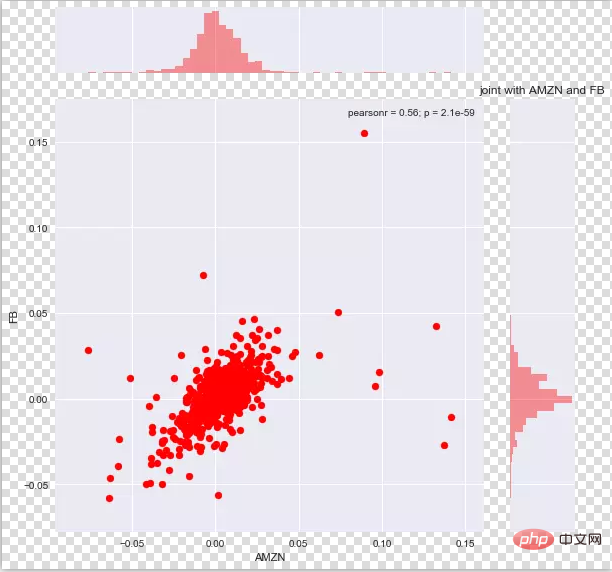
We learned from the above that there is some similarity in the closing price changes of Google and Amazon. Let’s take a look at the daily return rate.
sns.jointplot("AMZN",'FB',top_tech_dr,kind='scatter',color = 'red',size=8)
plt.title('joint with AMZN and FB')The yields of Google and Amazon also seem to be positively correlated, which can be used as a reference factor to predict the development of these two stocks.
The above is the detailed content of Can python be used to trade stocks?. For more information, please follow other related articles on the PHP Chinese website!

Hot AI Tools

Undresser.AI Undress
AI-powered app for creating realistic nude photos

AI Clothes Remover
Online AI tool for removing clothes from photos.

Undress AI Tool
Undress images for free

Clothoff.io
AI clothes remover

Video Face Swap
Swap faces in any video effortlessly with our completely free AI face swap tool!

Hot Article

Hot Tools

Notepad++7.3.1
Easy-to-use and free code editor

SublimeText3 Chinese version
Chinese version, very easy to use

Zend Studio 13.0.1
Powerful PHP integrated development environment

Dreamweaver CS6
Visual web development tools

SublimeText3 Mac version
God-level code editing software (SublimeText3)

Hot Topics
 1387
1387
 52
52
 Is the vscode extension malicious?
Apr 15, 2025 pm 07:57 PM
VS Code extensions pose malicious risks, such as hiding malicious code, exploiting vulnerabilities, and masturbating as legitimate extensions. Methods to identify malicious extensions include: checking publishers, reading comments, checking code, and installing with caution. Security measures also include: security awareness, good habits, regular updates and antivirus software.
 How to run programs in terminal vscode
Apr 15, 2025 pm 06:42 PM
In VS Code, you can run the program in the terminal through the following steps: Prepare the code and open the integrated terminal to ensure that the code directory is consistent with the terminal working directory. Select the run command according to the programming language (such as Python's python your_file_name.py) to check whether it runs successfully and resolve errors. Use the debugger to improve debugging efficiency.
 Can vs code run in Windows 8
Apr 15, 2025 pm 07:24 PM
VS Code can run on Windows 8, but the experience may not be great. First make sure the system has been updated to the latest patch, then download the VS Code installation package that matches the system architecture and install it as prompted. After installation, be aware that some extensions may be incompatible with Windows 8 and need to look for alternative extensions or use newer Windows systems in a virtual machine. Install the necessary extensions to check whether they work properly. Although VS Code is feasible on Windows 8, it is recommended to upgrade to a newer Windows system for a better development experience and security.
 Can visual studio code be used in python
Apr 15, 2025 pm 08:18 PM
VS Code can be used to write Python and provides many features that make it an ideal tool for developing Python applications. It allows users to: install Python extensions to get functions such as code completion, syntax highlighting, and debugging. Use the debugger to track code step by step, find and fix errors. Integrate Git for version control. Use code formatting tools to maintain code consistency. Use the Linting tool to spot potential problems ahead of time.
 Choosing Between PHP and Python: A Guide
Apr 18, 2025 am 12:24 AM
PHP is suitable for web development and rapid prototyping, and Python is suitable for data science and machine learning. 1.PHP is used for dynamic web development, with simple syntax and suitable for rapid development. 2. Python has concise syntax, is suitable for multiple fields, and has a strong library ecosystem.
 Can vscode be used for mac
Apr 15, 2025 pm 07:36 PM
VS Code is available on Mac. It has powerful extensions, Git integration, terminal and debugger, and also offers a wealth of setup options. However, for particularly large projects or highly professional development, VS Code may have performance or functional limitations.
 Can vscode run ipynb
Apr 15, 2025 pm 07:30 PM
The key to running Jupyter Notebook in VS Code is to ensure that the Python environment is properly configured, understand that the code execution order is consistent with the cell order, and be aware of large files or external libraries that may affect performance. The code completion and debugging functions provided by VS Code can greatly improve coding efficiency and reduce errors.
 Golang vs. Python: Concurrency and Multithreading
Apr 17, 2025 am 12:20 AM
Golang is more suitable for high concurrency tasks, while Python has more advantages in flexibility. 1.Golang efficiently handles concurrency through goroutine and channel. 2. Python relies on threading and asyncio, which is affected by GIL, but provides multiple concurrency methods. The choice should be based on specific needs.


