
1. Installation
Open http://www.xdebug.org/download.php to download the corresponding version
But please note that you must download The version that matches the php installed on the machine will work. So you can copy the information from the phpinfo web page to http://www.xdebug.org/find binary.php, and then install it according to the instructions. As shown in the picture below:
Click to download the dll file, and then copy it to the php extension directory, for example, mine is: D:\phpserver\php-7.0 .27-nts-x64\ext
2. Configure XDebug, open php.ini, and add the following code at the end:
[Xdebug]
;指定Xdebug扩展文件的绝对路径
zend_extension= D:\phpserver\php-7.0.27-nts-x64\ext\php_xdebug-2.6.1-7.0-vc14-nts-x86_64.dll
;启用性能检测分析
xdebug.profiler_enable=On
;启用代码自动跟踪
xdebug.auto_trace=on
;允许收集传递给函数的参数变量
xdebug.collect_params=On
;允许收集函数调用的返回值
xdebug.collect_return=On
;指定堆栈跟踪文件的存放目录
xdebug.trace_output_dir="D:/phpserver/tmp/Xdebug";指定性能分析文件的存放目录
xdebug.profiler_output_dir="D:/phpserver/tmp/Xdebug"xdebug.profiler_output_name = "cachegrind.out.%p"xdebug.
remote_enable = On
xdebug.remote_port=19000xdebug.remote_handler = dbgp
xdebug.remote_host = 127.0.0.1xdebug.var_display_max_depth = 10xdebug.idekey= PHPSTROM
Note: Modify zend_extension to your own expansion path and restart Apache.
Related recommendations: "PhpStorm Usage Tutorial"
3. You can search for the Xdebug module in the phpinfo page.
#Or enter php -m under cmd to see the XDebug module. As shown in the figure below:
# Another thing to note is the php version set in the system's environment variables. (For example, when multiple versions of PHP are configured)
phpStorm configuration
1.[File]->[Settings]->[Languages & Frameworks]->[ Configure xdebug service in PHP servers.
#2. Configure debug, debug port is xdebug.remote_port configured in php.ini.
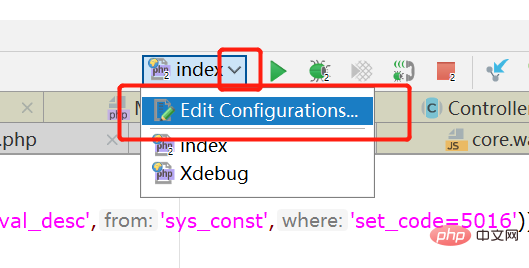
3. Open [run]--[Edit configurations]

The above is the detailed content of How to configure phpstorm xdebug. For more information, please follow other related articles on the PHP Chinese website!


