How to implement query optimization in navicat

Navicat Monitor is a secure, simple and agentless remote server monitoring tool. It has powerful functions to maximize your monitoring. Monitored servers include MySQL, MariaDB, and Percona Server, and are compatible with cloud databases such as Amazon RDS, Amazon Aurora, Oracle Cloud, Microsoft Azure, and Alibaba Cloud. Navicat Monitor is a server-based software that can be accessed from anywhere using a web browser. With network access, you can easily and seamlessly monitor the status of global servers around the clock.
One of the main complaints database administrators (DBAs) have about general and slow query logs is that their contents are difficult to read. The solution is to use navicat monitor for mysql/mariadb logs. Its Query Analyzer tool provides a graphical representation of query logs, enabling you to monitor and optimize query performance, visualize query activity statistics, analyze SQL statements, and quickly identify and resolve long-running queries.
Related recommendations: "Navicat for mysql tutorial"
Query Analyzer
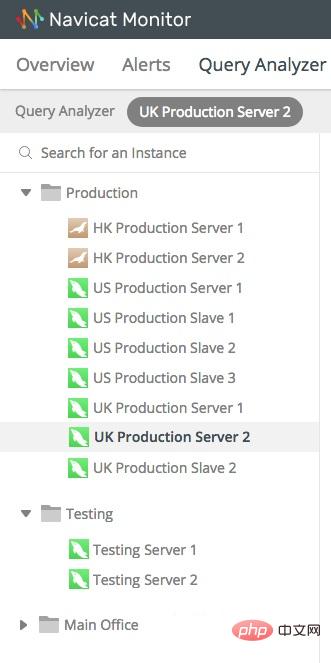
To start using Query Analyzer, please click on the left pane to select the instance you want to analyze:
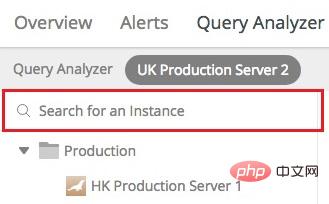
You can also narrow the list to the instance you are looking for by entering a name in the search field:
After selecting an instance, analysis starts immediately. After a short time, the analysis results will be displayed:
The screen is divided into the following parts:
·Latest Deadlock Query: Display the selected Transaction information of the latest Deadlocks detected in the instance.
·Process List: Displays the total number of processes running on the selected instance, and lists the last 5 processes, including ID, command type, user, database and time information.
·Query Analyzer: Displays information about query statements with customizable and sortable columns.
Latest Deadlock Query
If you want to see more than just the latest deadlock, you can click the View All button. This will open the Deadlock page. It displays all deadlocks detected on the selected instance:

All monitored instances are displayed in the left pane. Selecting an instance causes Deadlocks for that instance. You can filter the list by providing a value in the "Search for a deadlock" text box.
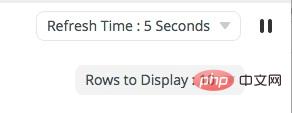
By default, the Deadlocks list is automatically refreshed every 5 seconds. The auto-refresh time can be changed using the "Refresh Time" drop-down menu. To pause automatic refresh, click the pause button:

You can also set the number of rows to display via the "Rows to Display" drop-down menu.
Process Table
You can click View All to view all processes.
The "Process List" page displays all processes currently running on the selected instance. You can check the currently executing query. The process list provides the following details:
(1) ID: Thread ID.
(2) User@Host: The user who issued the statement.
(3) DB: The database currently used by the user.
(4) Command: The type of command issued by the user.
(5) Time: The time (seconds) the thread is in the current state.
(6) State: Indicates the status of the operation being performed by the thread.
(7) Info: Statement issued by the user.
Like Deadlocks, all monitored instances are displayed in the left pane, where you can select an instance to display its process list. Like Deadlocks, the process list is automatically refreshed every 5 seconds. It also includes a refresh time drop-down menu to change the auto-refresh time. Click the Pause button to pause automatic refresh.
The thread list can be filtered and sorted. Simply enter a search string in the search thread box to filter the list, then click on a column name to sort the list. Additionally, clicking on a row to display and selecting a predefined number changes the number of threads displayed per page.
Kill the process
In addition to displaying the currently running process, you can also stop the thread immediately by clicking the "Action" column and then clicking "End Process" in the pop-up dialog box:
The above is the detailed content of How to implement query optimization in navicat. For more information, please follow other related articles on the PHP Chinese website!

Hot AI Tools

Undresser.AI Undress
AI-powered app for creating realistic nude photos

AI Clothes Remover
Online AI tool for removing clothes from photos.

Undress AI Tool
Undress images for free

Clothoff.io
AI clothes remover

Video Face Swap
Swap faces in any video effortlessly with our completely free AI face swap tool!

Hot Article

Hot Tools

Notepad++7.3.1
Easy-to-use and free code editor

SublimeText3 Chinese version
Chinese version, very easy to use

Zend Studio 13.0.1
Powerful PHP integrated development environment

Dreamweaver CS6
Visual web development tools

SublimeText3 Mac version
God-level code editing software (SublimeText3)

Hot Topics
 1657
1657
 14
14
 1415
1415
 52
52
 1309
1309
 25
25
 1257
1257
 29
29
 1230
1230
 24
24
 How to use navicat keygen patch
Apr 09, 2025 am 07:18 AM
Navicat Keygen Patch is a key generator that activates Navicat Premium, allowing you to use the full functionality of the software without purchasing a license. How to use: 1) Download and install Keygen Patch; 2) Start Navicat Premium; 3) Generate the serial number and activation code; 4) Copy the key; 5) Activate Navicat Premium, and Navicat Premium can be activated.
 How to see if navicat is activated
Apr 09, 2025 am 07:30 AM
How to check if Navicat is activated: View the Registration Information section in the "About Navicat" of the Help menu: Activated: Show valid registration information (name, organization, expiration date) Not activated: Show "Not Registered" or "Register Information Not Available" Check the activation icon in the toolbar: The green icon indicates that the active observation trial period countdown: The trial version will show the countdown at startup, the activated version will not view feature limitations: The trial version may limit advanced features, and the activated version will unlock all functions
 How to import sql file into navicat
Apr 09, 2025 am 06:24 AM
How to import SQL files using Navicat? Open Navicat and connect to the database. Open the SQL Editor. Import SQL files. Set import options (optional). Perform import. Check the import results.
 How to export the results of a navicat query
Apr 09, 2025 am 06:21 AM
Export query results with Navicat can be performed step by step: 1. Select the data to export 2. Select the export format: CSV, Excel, XML, or JSON 3. Configure the export options: Select columns, separators, and filters 4. Select the save location 5. Start exporting 6. Verify the results
 How to execute sql in navicat
Apr 08, 2025 pm 11:42 PM
Steps to perform SQL in Navicat: Connect to the database. Create a SQL Editor window. Write SQL queries or scripts. Click the Run button to execute a query or script. View the results (if the query is executed).
 How to roll back navicat
Apr 09, 2025 am 06:15 AM
Navicat provides rollback functionality to undo database changes. The rollback steps are as follows: Connect the database to expand the database to be rolled back in the object browser. Right-click the table and select "Rolleepback" to select the rollback time point. Click "OK"
 How to create stored procedures with navicat
Apr 08, 2025 pm 11:36 PM
You can use Navicat to create a stored procedure, the steps are as follows: Open the database object list and expand the "Procedures" node. Right-click the Procedures node and select Create Procedure. Enter the stored procedure name and body and set the parameters (if required). Select Compile in the File menu to compile the stored procedure. By executing a query or using "E in the "Procedures" list
 What to do if the error is running sql file in navicat
Apr 09, 2025 am 09:09 AM
To resolve errors when Navicat runs SQL files, follow these steps: 1. Check for SQL syntax errors; 2. Make sure the database connection is established; 3. Check file encoding; 4. Adjust server settings; 5. Check temporary space; 6. Disable certain plugins; 7. Contact Navicat Support if necessary.


