Java Eclipse for breakpoint debugging
How to debug a Java program?
When everyone first learns Java, they will think that there is no high-end IDE for debugging, but it is actually very simple.
The following will teach you how to debug in Eclipse as simply and intuitively as possible. The steps for debugging other IDEs are also similar.
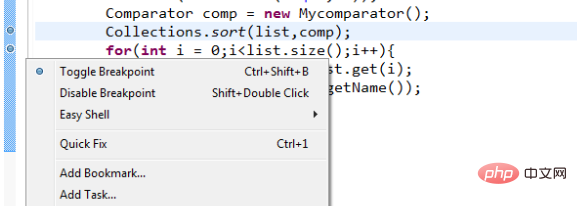
#1. Set a breakpoint where you think something is wrong.
Right-click in front of the line of code, pay attention to the right-click, and then select Toggle Breakpoint.
#You may ask, how do I know where to place a breakpoint?
If you don’t feel this problem at all, you can set a few more breakpoints and step through the debugging until you find the exception. It just takes a little more time, and you can have a deeper understanding of the execution of the program. process!
Of course, if you can roughly know where the problem may occur or where the exception information report is, then you can set a breakpoint here.
2. Click Debug. If it is a web program, you need to start the Tomcat or Apache server in Debug mode.
This is very important. The standard Start mode cannot enter the preset breakpoint, and the purpose of debugging cannot be achieved.

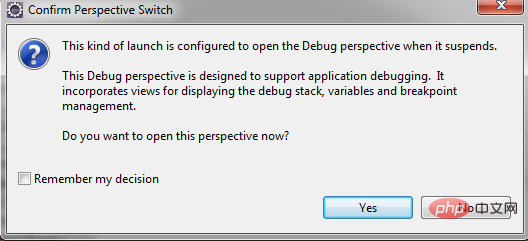
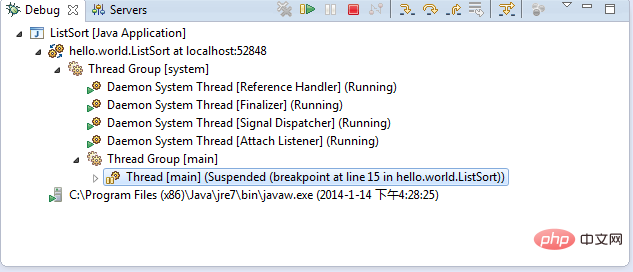
#3. Run the program. When the program reaches the breakpoint you just set, it will stop and the background color of that line of code will be highlighted.
 At this time, you can control the program through the on-screen buttons or keyboard.
The following are the keyboard shortcuts corresponding to debugging. If it does not work, you can check whether there is a keyboard conflict.
For example, the shortcut keys of Youdao Dictionary often conflict with Resume in Debud mode.
Scope function shortcut keys
Global single step returns to F7
Global single step skips F6
Global single step jumps Enter F5
Global single-step into select Ctrl F5
Global debugging last started F11
Global continue F8
Global single-step execution using filter Shift F5
Add/remove breakpoints globally Ctrl Shift B
Display globally Ctrl D
Run globally Last startup Ctrl F11
Run globally to line Ctrl R
Global execution Ctrl U
4. Enter the debugging interface to see the information you want.
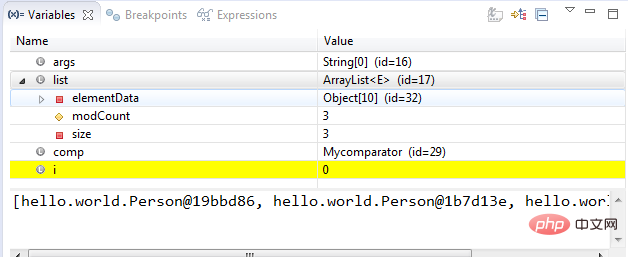
5. You can view the values of all variables in Variables, such as the value in the breakpoint you just set. You can change it by right-clicking ChangeValue. Some IDEs Supports hot changing and executing code in the window.
6. The first button below is to enter method execution. For example, if you call other methods, you can enter the method and execute it step by step. If you click The two buttons will only be executed step by step within this method. When you press the third button, you will jump out of this method and continue to execute the original method that called this method. The instructions are as follows.
7. Finish executing the program.
8. Add decompilation plug-in for Eclipse for better debugging
Generally speaking, our projects will be more or less Referring to some external jar packages, if we can view the source code of the jar package, it can be said to be twice the result with half the effort for our debugging.
1. Download and install jad.exe. Unzip jad.exe to the program directory (you can place it in any directory), for example: C:\Program Files\Jad\jad.exe.
2. Install the jadclipse plug-in. Download and unzip net.sf.jadclipse_3.3.0.jar, copy it to the eclipse\plugins directory, and restart eclipse.
3. Configure jadclipse. Under the eclipse window, click Window > Preferences > Java > JadClipse > Path to Decompiler.
(Set the absolute path of jad, such as C:\Program Files\Jad\jad.exe)
You can check the Use Eclipse code formatter (overrides Jad formatting instructions) option, so that you can The code style formatted by Ctrl Shif F is consistent.
After executing these steps, click View on the class or method imported from the Jar package to view the source code. If not, refer to the following solutions:
Most In this case, eclipse failed to automatically set the JadClipse Class File Viewer as the default opening method for class files.
Modify the default associated editors of "*.class" and "*.class without source" in Eclipse's Windows-> Perference->General->Editors->File Associations to "JadClipse Class File Viewer".
I have configured the jad plug-in several times. If it cannot be decompiled, after setting it like this, it works every time.
The above is the detailed content of Java Eclipse for breakpoint debugging. For more information, please follow other related articles on the PHP Chinese website!

Hot AI Tools

Undresser.AI Undress
AI-powered app for creating realistic nude photos

AI Clothes Remover
Online AI tool for removing clothes from photos.

Undress AI Tool
Undress images for free

Clothoff.io
AI clothes remover

Video Face Swap
Swap faces in any video effortlessly with our completely free AI face swap tool!

Hot Article

Hot Tools

Notepad++7.3.1
Easy-to-use and free code editor

SublimeText3 Chinese version
Chinese version, very easy to use

Zend Studio 13.0.1
Powerful PHP integrated development environment

Dreamweaver CS6
Visual web development tools

SublimeText3 Mac version
God-level code editing software (SublimeText3)

Hot Topics
 1389
1389
 52
52
 Perfect Number in Java
Aug 30, 2024 pm 04:28 PM
Guide to Perfect Number in Java. Here we discuss the Definition, How to check Perfect number in Java?, examples with code implementation.
 Weka in Java
Aug 30, 2024 pm 04:28 PM
Guide to Weka in Java. Here we discuss the Introduction, how to use weka java, the type of platform, and advantages with examples.
 Smith Number in Java
Aug 30, 2024 pm 04:28 PM
Guide to Smith Number in Java. Here we discuss the Definition, How to check smith number in Java? example with code implementation.
 Java Spring Interview Questions
Aug 30, 2024 pm 04:29 PM
In this article, we have kept the most asked Java Spring Interview Questions with their detailed answers. So that you can crack the interview.
 Break or return from Java 8 stream forEach?
Feb 07, 2025 pm 12:09 PM
Java 8 introduces the Stream API, providing a powerful and expressive way to process data collections. However, a common question when using Stream is: How to break or return from a forEach operation? Traditional loops allow for early interruption or return, but Stream's forEach method does not directly support this method. This article will explain the reasons and explore alternative methods for implementing premature termination in Stream processing systems. Further reading: Java Stream API improvements Understand Stream forEach The forEach method is a terminal operation that performs one operation on each element in the Stream. Its design intention is
 TimeStamp to Date in Java
Aug 30, 2024 pm 04:28 PM
Guide to TimeStamp to Date in Java. Here we also discuss the introduction and how to convert timestamp to date in java along with examples.
 Java Program to Find the Volume of Capsule
Feb 07, 2025 am 11:37 AM
Capsules are three-dimensional geometric figures, composed of a cylinder and a hemisphere at both ends. The volume of the capsule can be calculated by adding the volume of the cylinder and the volume of the hemisphere at both ends. This tutorial will discuss how to calculate the volume of a given capsule in Java using different methods. Capsule volume formula The formula for capsule volume is as follows: Capsule volume = Cylindrical volume Volume Two hemisphere volume in, r: The radius of the hemisphere. h: The height of the cylinder (excluding the hemisphere). Example 1 enter Radius = 5 units Height = 10 units Output Volume = 1570.8 cubic units explain Calculate volume using formula: Volume = π × r2 × h (4
 Create the Future: Java Programming for Absolute Beginners
Oct 13, 2024 pm 01:32 PM
Java is a popular programming language that can be learned by both beginners and experienced developers. This tutorial starts with basic concepts and progresses through advanced topics. After installing the Java Development Kit, you can practice programming by creating a simple "Hello, World!" program. After you understand the code, use the command prompt to compile and run the program, and "Hello, World!" will be output on the console. Learning Java starts your programming journey, and as your mastery deepens, you can create more complex applications.


