
1. Set a breakpoint where you need to debug
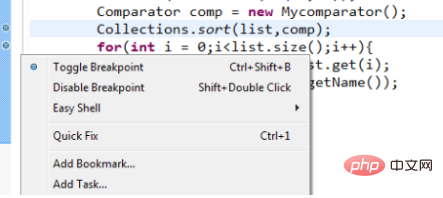
Right-click in front of the line of code, pay attention to the right-click, and then select Toggle Breakpoint.
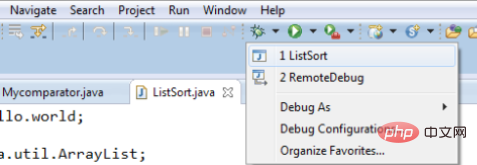
#2. Click Debug. If it is a web program, you need to start the Tomcat or Apache server in Debug mode. This is very important. The standard Start mode cannot enter the preset breakpoint, and therefore cannot achieve the purpose of debugging.
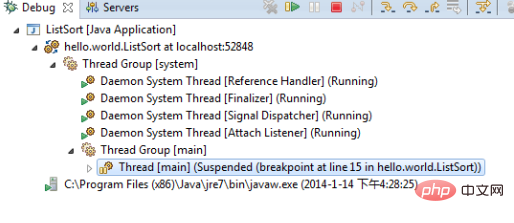
#3. Run the program. When the program reaches the breakpoint you just set, it will stop, and the background color of that line of code will be highlighted
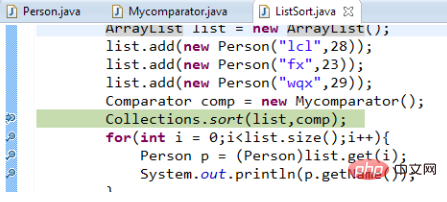
At this time, you can control the program through the on-screen buttons or keyboard.
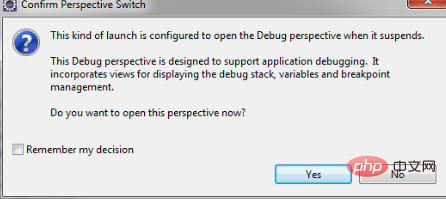
4. Enter the debugging interface to see the information you want
5. You can view the values of all variables in Variables, such as the ones you just set The value in the breakpoint can be changed by right-clicking ChangeValue. Some IDEs support hot changes and executing code in the window
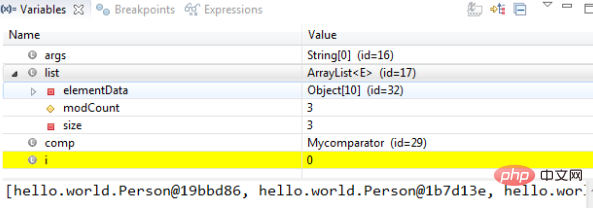
6. The first button below is to enter method execution, such as If you call other methods, you can enter the method and execute it step by step. If you click the second button, it will only be executed step by step within this method. When you click the third button, you jump out of this method and continue to execute the original method that called this method. Note As follows:
Recommended tutorial: Java tutorial
The above is the detailed content of How to debug java program in eclipse. For more information, please follow other related articles on the PHP Chinese website!