How to debug html with vscode
How to debug html with vscode?
Use Debugger for Chrome for debugging
First download the corresponding plug-in
Ctrl Shift x to open the plug-in store, search chrome to see the plug-in, click to install ->Just reload
There are two configuration methods for this plug-in, one is debugging based on local files, and the other is debugging based on server-client mode.
Local file debugging starts chrome to read local files, and then directly renders the page based on the file
server-client loads the file to be debugged into the service container (such as tomcat and the like) ), all documents are provided as a service.
Chrome accesses the file based on the url address of the service and then loads it into the browser.
Related recommendations: "vscode tutorial"
The two configuration methods are introduced below
1.1.1. Debugging based on local file configuration
Create a new launch.json file under the .vscode folder and add the configuration as follows
{
  "version": "0.2.0",
  "configurations": [
    {
      "type": "chrome",
      "request": "launch",
      "name": "Launch Chrome 本地调试",
      "url": "http://localhost:8080",
      "webRoot": "${workspaceFolder}",
      "file": "${file}"
    }
  ]
}Configuration explanation:
${file} means opening the current file
${workspaceRoot} represents the current loading root directory of vscode
launch represents a new chrome process to load the file
Attach relative to launch, indicating that the current file is loaded into the existing chrome process
Select the [Launch Chrome local debugging] option in the debugging menu bar, click [f5] or [fn f5], you can see the page
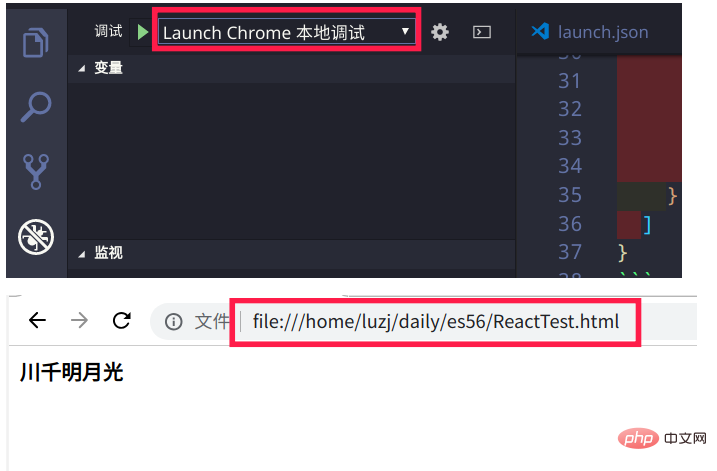
You can see it Above the url search bar is an address starting with file:///, which indicates that the file is read locally. After that, all
html files can be debugged like this
1.1.2. Debugging based on server configuration
1.1.2.1. Start the server
Based on the server-client method, the file must be loaded into the server container first. Tomcat is not used here, but the
python method is used.
In the bash terminal, cd into the root directory of vscode, for example, mine is ~/daily, run the following command
cd ~/daily
# Load files in the current directory Enter the container, the external port is 8080, host is the local ip, and localhost can be used for local access
python3 -m http.server 8080
1.1.2.2. Configure vscode
Add the following configuration information to the launch.json file,
{
"type": "chrome",
"request": "launch",
"name": "Launch Chrome from http",
"url": "http://localhost:8080/${relativeFile}",
"webRoot": "${workspaceFolder}"
},${workspaceFolder} represents the path relative to the root directory
Then select [Launch Chrome from http], click [f5] or [fn f5] You can see that chrome has loaded the file. At the same time, we can also see from the address in the search bar that chrome uses the http protocol to access files this time

1.2. Debugging using Nodejs
Debugging using Nodejs The configuration method is basically the same as chrome, but the type is changed, as follows
{
    "type": "node",
    "request": "launch",
    "name": "Node Launch Program",
    "program": "${workspaceFolder}/${relativeFile}"
},Select [Node Launch Program] in the debugger menu bar, and then click [f5], the debugging information will be displayed below
On the debugging console, screenshots will not be taken.
If nodeJs is not installed, you can run the following command on a debian computer.
apt install nodejs npm
Generally, using apt to install may cause the version to be lagging behind. You can Use source code installation, official installation manager or configure ppa.
I choose to configure ppa, using the LTS version of 10.x
$ cat /etc/apt/sources.list.d/nodesource.list
deb https://deb.nodesource.com/node_10.x sid main
deb-src https://deb.nodesource.com/node_10.x sid main
The above is the detailed content of How to debug html with vscode. For more information, please follow other related articles on the PHP Chinese website!

Hot AI Tools

Undresser.AI Undress
AI-powered app for creating realistic nude photos

AI Clothes Remover
Online AI tool for removing clothes from photos.

Undress AI Tool
Undress images for free

Clothoff.io
AI clothes remover

Video Face Swap
Swap faces in any video effortlessly with our completely free AI face swap tool!

Hot Article

Hot Tools

Notepad++7.3.1
Easy-to-use and free code editor

SublimeText3 Chinese version
Chinese version, very easy to use

Zend Studio 13.0.1
Powerful PHP integrated development environment

Dreamweaver CS6
Visual web development tools

SublimeText3 Mac version
God-level code editing software (SublimeText3)

Hot Topics
 1386
1386
 52
52
 What computer configuration is required for vscode
Apr 15, 2025 pm 09:48 PM
VS Code system requirements: Operating system: Windows 10 and above, macOS 10.12 and above, Linux distribution processor: minimum 1.6 GHz, recommended 2.0 GHz and above memory: minimum 512 MB, recommended 4 GB and above storage space: minimum 250 MB, recommended 1 GB and above other requirements: stable network connection, Xorg/Wayland (Linux)
 How to define header files for vscode
Apr 15, 2025 pm 09:09 PM
How to define header files using Visual Studio Code? Create a header file and declare symbols in the header file using the .h or .hpp suffix name (such as classes, functions, variables) Compile the program using the #include directive to include the header file in the source file. The header file will be included and the declared symbols are available.
 How to switch Chinese mode with vscode
Apr 15, 2025 pm 11:39 PM
VS Code To switch Chinese mode: Open the settings interface (Windows/Linux: Ctrl, macOS: Cmd,) Search for "Editor: Language" settings Select "Chinese" in the drop-down menu Save settings and restart VS Code
 Common commands for vscode terminal
Apr 15, 2025 pm 10:06 PM
Common commands for VS Code terminals include: Clear the terminal screen (clear), list the current directory file (ls), change the current working directory (cd), print the current working directory path (pwd), create a new directory (mkdir), delete empty directory (rmdir), create a new file (touch) delete a file or directory (rm), copy a file or directory (cp), move or rename a file or directory (mv) display file content (cat) view file content and scroll (less) view file content only scroll down (more) display the first few lines of the file (head)
 vscode Previous Next Shortcut Key
Apr 15, 2025 pm 10:51 PM
VS Code One-step/Next step shortcut key usage: One-step (backward): Windows/Linux: Ctrl ←; macOS: Cmd ←Next step (forward): Windows/Linux: Ctrl →; macOS: Cmd →
 How to use VSCode
Apr 15, 2025 pm 11:21 PM
Visual Studio Code (VSCode) is a cross-platform, open source and free code editor developed by Microsoft. It is known for its lightweight, scalability and support for a wide range of programming languages. To install VSCode, please visit the official website to download and run the installer. When using VSCode, you can create new projects, edit code, debug code, navigate projects, expand VSCode, and manage settings. VSCode is available for Windows, macOS, and Linux, supports multiple programming languages and provides various extensions through Marketplace. Its advantages include lightweight, scalability, extensive language support, rich features and version
 How to set vscode in Chinese
Apr 15, 2025 pm 09:27 PM
There are two ways to set up a Chinese language in Visual Studio Code: 1. Install the Chinese language package; 2. Modify the "locale" settings in the configuration file. Make sure Visual Studio Code version is 1.17 or higher.
 What is the difference between vscode and pycharm
Apr 15, 2025 pm 11:54 PM
The main differences between VS Code and PyCharm are: 1. Extensibility: VS Code is highly scalable and has a rich plug-in market, while PyCharm has wider functions by default; 2. Price: VS Code is free and open source, and PyCharm is paid for professional version; 3. User interface: VS Code is modern and friendly, and PyCharm is more complex; 4. Code navigation: VS Code is suitable for small projects, and PyCharm is more suitable for large projects; 5. Debugging: VS Code is basic, and PyCharm is more powerful; 6. Code refactoring: VS Code is basic, and PyCharm is richer; 7. Code


