

##run->edit configurations (Recommended learning: phpstorm detailed explanation)
StartUrl is best to be a URL, otherwise it is easy to make mistakes. Server chooses Servers added during configuration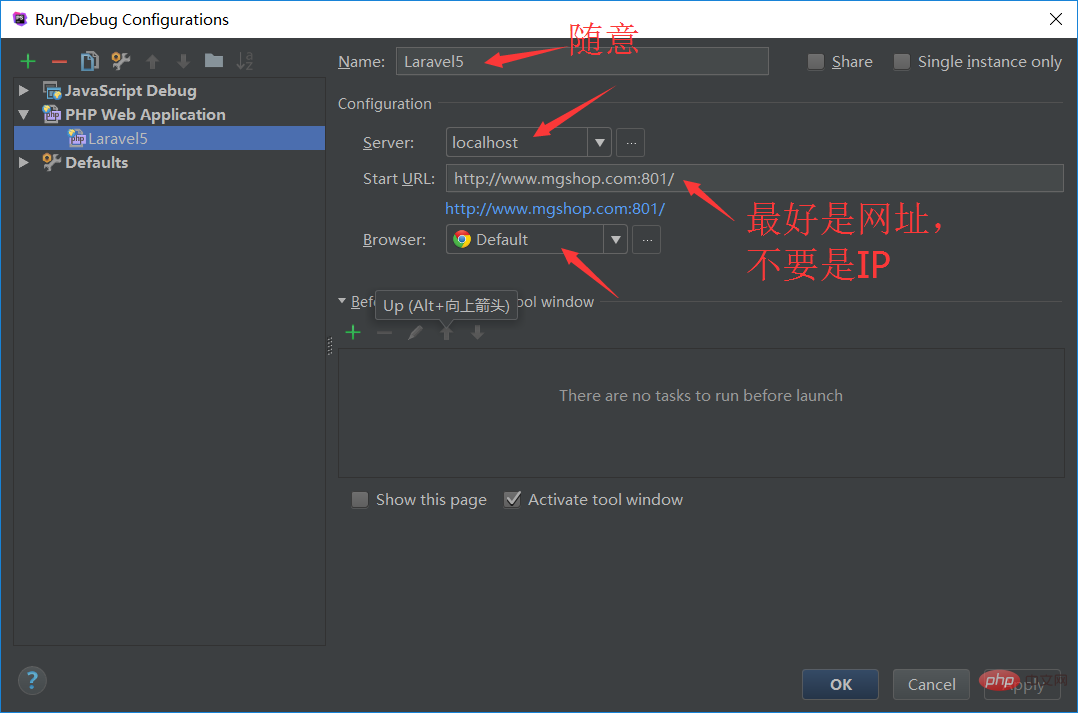
I have installed two extensions for Chrome Google Chrome, and they are both enabled
JetBrains IDE Support, xdebug helper for chrome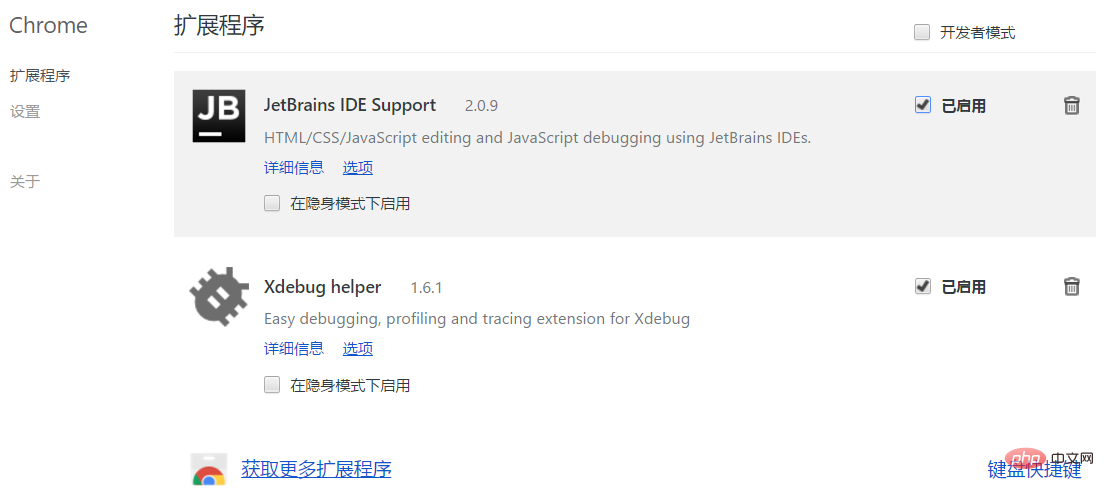 When accessing the page and preparing to enter the breakpoint, PHPStorm reported an error:
Cannot accept external Xdebug connection: Cannot evaluate expression'isset($_SERVER['PHP_IDE_CONFIG'])';
Cause One possible reason for this problem is that the server-side php.ini is configured with:
extension=/path/xdebug.so
. Only the following one should be retained:
zend_extension=/path/xdebug.so
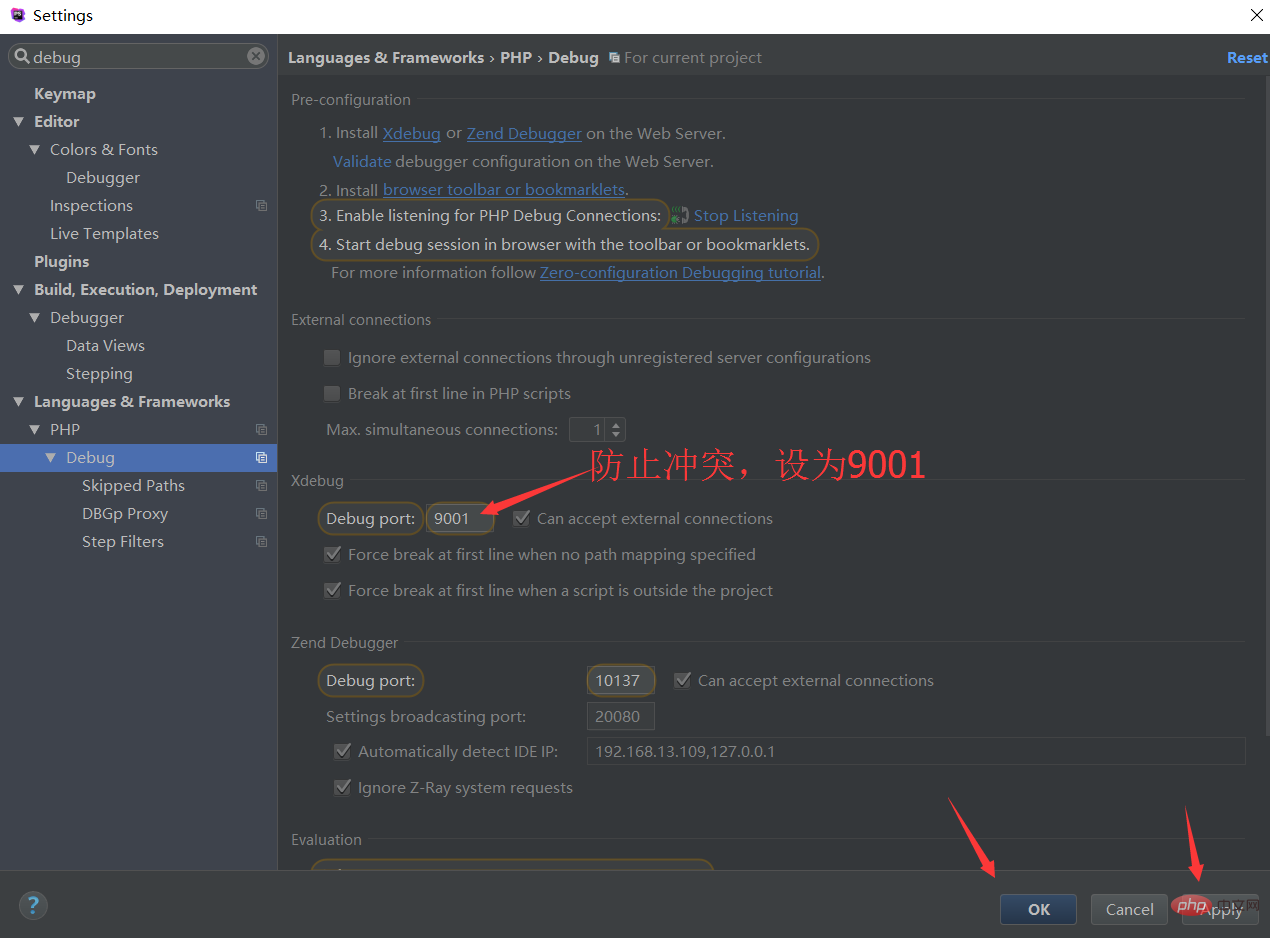
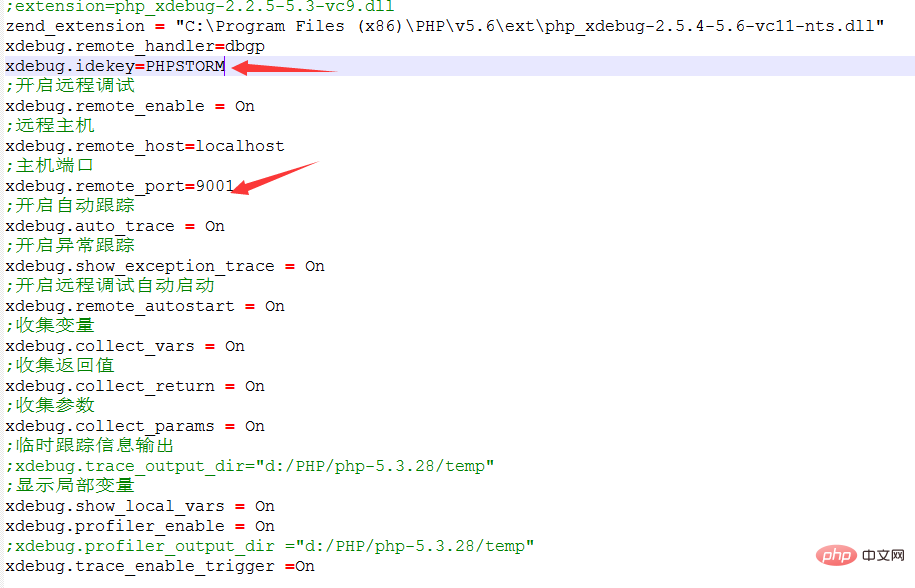
In addition It is best to change the port 9000 to 9001. Phpstorm and xdebug must be synchronized. The IDEkey must be consistent
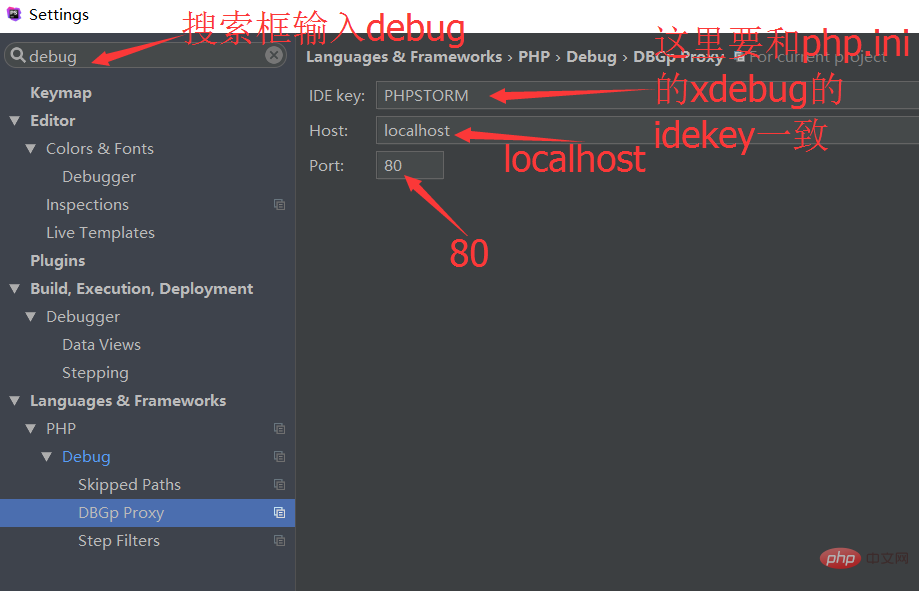
The above is the detailed content of Detailed explanation of phpstorm+xdebug. For more information, please follow other related articles on the PHP Chinese website!