Understand the concept of GC in JAVA in 3 minutes

Preface
GC (Garbage Collection) is an inevitable hurdle in the process of learning JVM. Next, let's study GC systematically.
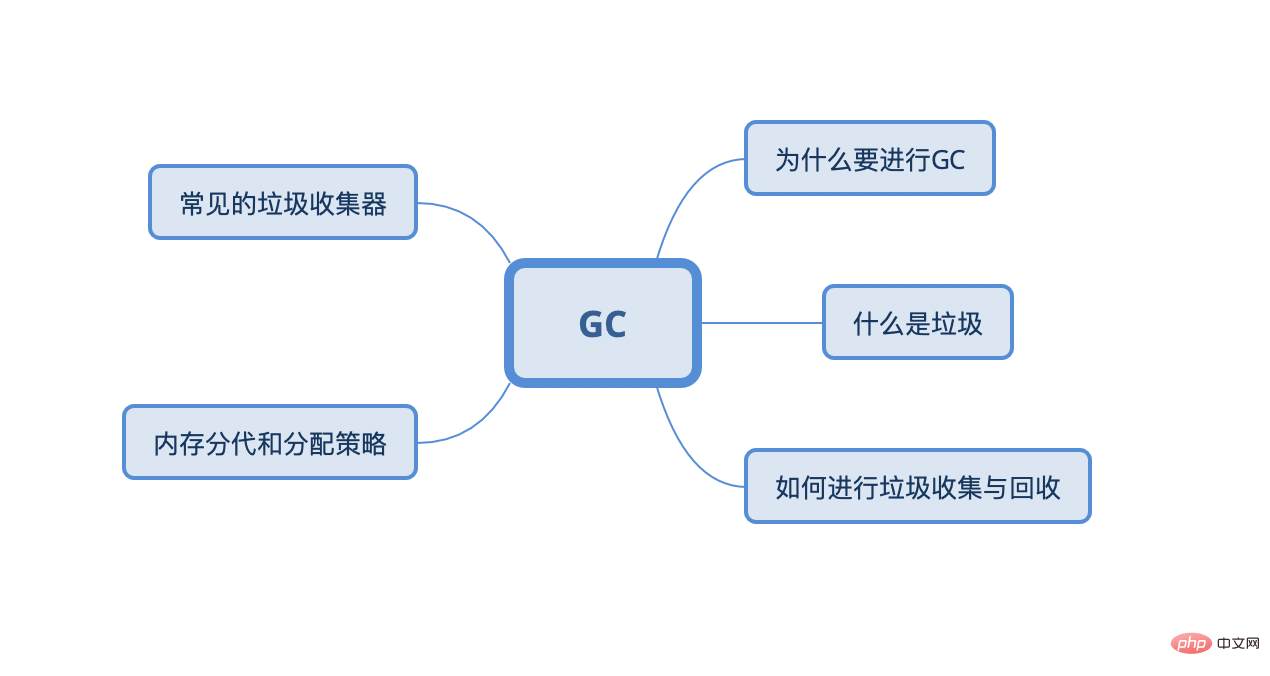
Before doing something, we must know why we are doing it. This does not only refer to GC, but also applies to our daily study and life. Know why. , only if you know why, can you fight without danger.
(Recommended video: java video tutorial)
Let’s first understand why there is a GC and what role the GC plays in the JVM. What effect did it have?
Why is there a GC
Students who have used C may know that the memory occupied by the object is occupied until the program ends and cannot be allocated until it is explicitly released. to other objects. If we do not manually clear these useless objects, the memory will soon be filled up. In the JVM, the GC plays the role of a scavenger. It can help us determine which objects are useless objects and how to proceed. Garbage collection, and the strategies that determine memory generation and memory allocation**.
Some students may ask, since our JVM will do GC work for us, why should we learn GC? Isn’t it good to leave everything to the JVM? Of course, in our daily life, we generally do not care about some details of GC, but when we encounter memory leaks, memory overflows, and high concurrency bottlenecks, we need to operate on GC and conduct more detailed analysis. Monitor and regulate.
Memory leak: refers to the dynamically allocated heap memory in the program that is not released or cannot be released for some reason, resulting in a waste of system memory, leading to serious consequences such as slowed down program running speed or even system crash. .
Memory overflow: There is unrecoverable memory in the application system or too much memory is used, which ultimately causes the memory used by the program to run greater than the maximum memory that can be provided.
Then the question now comes, we have to carry out garbage collection, first we need to know where the garbage is
Where the garbage is
In front We talked about the runtime memory area of JVM, and we know that threads can be divided into thread exclusive areas and thread shared areas. The memory life cycle of the thread exclusive area (program counter, virtual machine stack, local method stack) is consistent with the thread, and The memory size allocated in these areas is related to the size of the class. In other words, when our class structure is fixed, this part of the memory will not change, and when the method or thread ends, the memory will naturally follow. The heap memory and method area in the thread shared area are different. The memory used in the heap memory and method area cannot be determined during compilation, because different implementations of an interface and a method The code executed by different control condition branches may be completely opposite. We only know which objects will be created at runtime. The allocation and recycling of this part of memory are dynamic, and our GC focuses on this part of the memory.
For example: If the JVM is a car, the thread exclusive area is like parts. The lifespan of these parts is basically known when they leave the factory, and the thread shared area is like gasoline. , the consumption of gasoline is related to the route we take, so the part we focus on is that this part will change dynamically, such as how to drive more fuel-efficient~
This article comes from php Chinese website,
java tutorialThe above is the detailed content of Understand the concept of GC in JAVA in 3 minutes. For more information, please follow other related articles on the PHP Chinese website!

Hot AI Tools

Undresser.AI Undress
AI-powered app for creating realistic nude photos

AI Clothes Remover
Online AI tool for removing clothes from photos.

Undress AI Tool
Undress images for free

Clothoff.io
AI clothes remover

Video Face Swap
Swap faces in any video effortlessly with our completely free AI face swap tool!

Hot Article

Hot Tools

Notepad++7.3.1
Easy-to-use and free code editor

SublimeText3 Chinese version
Chinese version, very easy to use

Zend Studio 13.0.1
Powerful PHP integrated development environment

Dreamweaver CS6
Visual web development tools

SublimeText3 Mac version
God-level code editing software (SublimeText3)

Hot Topics
 1390
1390
 52
52
 What does the metaverse concept mean? What is the metaverse concept?
Feb 22, 2024 pm 03:55 PM
The Metaverse is an illusory world that uses technology to map and interact with the real world. Analysis 1 Metaverse [Metaverse] is an illusory world that makes full use of technological methods to link and create, and maps and interacts with the real world. It is a data living space with the latest social development system. The 2-dimensional universe is essentially a virtual technology and digital process of the real world, which requires a lot of transformation of content production, economic system, customer experience and physical world content. 3 However, the development trend of the metaverse is gradual. It is finally formed by the continuous combination and evolution of many tools and platforms with the support of shared infrastructure, standards and protocols. Supplement: What is the metaverse composed of? 1 The metaverse is composed of Meta and Verse, Meta is transcendence, and V
 Master the key concepts of Spring MVC: Understand these important features
Dec 29, 2023 am 09:14 AM
Understand the key features of SpringMVC: To master these important concepts, specific code examples are required. SpringMVC is a Java-based web application development framework that helps developers build flexible and scalable structures through the Model-View-Controller (MVC) architectural pattern. web application. Understanding and mastering the key features of SpringMVC will enable us to develop and manage our web applications more efficiently. This article will introduce some important concepts of SpringMVC
 Learn more about Gunicorn's fundamentals and features
Jan 03, 2024 am 08:41 AM
Basic concepts and functions of Gunicorn Gunicorn is a tool for running WSGI servers in Python web applications. WSGI (Web Server Gateway Interface) is a specification defined by the Python language and is used to define the communication interface between web servers and web applications. Gunicorn enables Python web applications to be deployed and run in production environments by implementing the WSGI specification. The function of Gunicorn is to
 Discussion on Golang's gc optimization strategy
Mar 06, 2024 pm 02:39 PM
Golang's garbage collection (GC) has always been a hot topic among developers. As a fast programming language, Golang's built-in garbage collector can manage memory very well, but as the size of the program increases, some performance problems sometimes occur. This article will explore Golang’s GC optimization strategies and provide some specific code examples. Garbage collection in Golang Golang's garbage collector is based on concurrent mark-sweep (concurrentmark-s
 Introduction and core concepts of Oracle RAC
Mar 07, 2024 am 11:39 AM
Introduction and core concepts of OracleRAC (RealApplicationClusters) As the amount of enterprise data continues to grow and the demand for high availability and high performance becomes increasingly prominent, database cluster technology becomes more and more important. OracleRAC (RealApplicationClusters) is designed to solve this problem. OracleRAC is a high-availability, high-performance cluster database solution launched by Oracle.
 Write a Java program to calculate the area and perimeter of a rectangle using the concept of classes
Sep 03, 2023 am 11:37 AM
The Java language is one of the most commonly used object-oriented programming languages in the world today. The concept of classes is one of the most important features of object-oriented languages. A class is like a blueprint for an object. For example, when we want to build a house, we first create a blueprint of the house, in other words, we create a plan that shows how we are going to build the house. According to this plan we can build many houses. Likewise, using classes, we can create many objects. Classes are blueprints for creating many objects, where objects are real-world entities like cars, bikes, pens, etc. A class has the characteristics of all objects, and the objects have the values of these characteristics. In this article, we will write a Java program to find the perimeter and faces of a rectangle using the concept of classes
 What is the Oracle home directory? Detailed explanation of the concept and function of Oracle home directory
Mar 08, 2024 am 08:18 AM
Title: Oracle Master Catalog: Concepts, Functions and Code Examples The master catalog (MasterCatalog) in the Oracle database is the basic directory structure of the database and is used to store metadata about database objects and other database information. The home directory plays the role of the management center of the database, recording information about all objects in the database, such as tables, indexes, views, users, etc., and also includes database configuration information and permission information. In Oracle database, the concept of home directory is very important, it is used
 Uncovering the secrets of Java recursion: from theory to application
Jan 30, 2024 am 10:07 AM
Exploring the Mysteries of Java Recursion: From Concept to Practice Introduction: Recursion is an important programming technique in computer science and is widely used in many algorithms and data structures. As a popular programming language, Java also provides a powerful recursive mechanism. This article will take you to explore the mysteries of Java recursion by analyzing the concepts, principles and practical applications of recursion. 1. Concept and Principle of Recursion 1.1 Definition of Recursion Recursion means that when solving a problem, the problem is broken down into smaller sub-problems with the same structure and solved by calling itself.


