 Operation and Maintenance
 Linux Operation and Maintenance
 What are the methods of program debugging in Linux?
What are the methods of program debugging in Linux?

#1. Use the 'print' statement
This is a basic method for debugging problems. We insert print statements at suspicious places in the program to understand the program's running flow control flow and changes in variable values.
Its disadvantage is that it requires program editing, adding a 'print' statement, and must be recompiled and rerun to obtain the output. If the program that needs to be debugged is relatively large, this will be a time-consuming and labor-intensive method.
2. Use query
In some cases, we need to figure out the status and memory mapping of a process running in the kernel. To get this information, we don't need to insert any code in the kernel. Instead, use the /proc file system. In the pseudo file system of /proc, the running information (cpu information, memory capacity, etc.) collected when the system is started is retained.
The output of ls -l /proc shows that for each process running in the system, there is an entry named after the process ID in the /proc file system. Detailed information for each process can be obtained in the file in the directory corresponding to the process ID. The output of 'ls /proc/pid' can also be used.
Free video tutorial recommendation: linux video tutorial
3. Use tracking
strace and ltrace are two A tracing tool used in Linux to trace the execution details of a program.
strace:
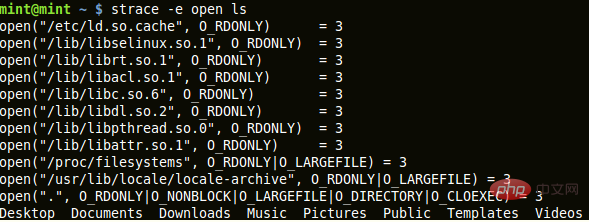
strace intercepts and records system calls and the signals they receive. To the user, it shows the system calls, the parameters passed to them, and the return values. strace can be attached to an already running process or to a new process. It is useful as a diagnostic and debugging tool for developers and system administrators.
It can also be used as a tool to understand the system by tracing different program calls. The advantage of this tool is that it does not require source code and the program does not need to be recompiled.
The basic syntax for using strace is:
strace 命令
The output of strace is very long, and we usually are not interested in every line displayed. We can use the '-e expr' option to filter unwanted data.
Use the '-p pid' option to bind to a running process.
With the '-o' option, the output of the command can be redirected to a file.

#strace filters the output of only system calls.
ltrace:
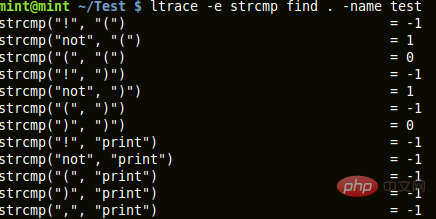
ltrace tracks and records a process's dynamic (runtime) library calls and the signals it receives. It can also track system calls made by a process. Its usage is similar to strace.
ltrace command
'-i' option prints the instruction pointer when calling the library.
'-S' option is used to capture system calls and library calls.

trace captures 'STRCMP' library calls output.
Recommended related articles and tutorials: linux tutorial
The above is the detailed content of What are the methods of program debugging in Linux?. For more information, please follow other related articles on the PHP Chinese website!

Hot AI Tools

Undresser.AI Undress
AI-powered app for creating realistic nude photos

AI Clothes Remover
Online AI tool for removing clothes from photos.

Undress AI Tool
Undress images for free

Clothoff.io
AI clothes remover

AI Hentai Generator
Generate AI Hentai for free.

Hot Article

Hot Tools

Notepad++7.3.1
Easy-to-use and free code editor

SublimeText3 Chinese version
Chinese version, very easy to use

Zend Studio 13.0.1
Powerful PHP integrated development environment

Dreamweaver CS6
Visual web development tools

SublimeText3 Mac version
God-level code editing software (SublimeText3)

Hot Topics
 Android TV Box gets unofficial Ubuntu 24.04 upgrade
Sep 05, 2024 am 06:33 AM
For many users, hacking an Android TV box sounds daunting. However, developer Murray R. Van Luyn faced the challenge of looking for suitable alternatives to the Raspberry Pi during the Broadcom chip shortage. His collaborative efforts with the Armbia
 deepseek web version entrance deepseek official website entrance
Feb 19, 2025 pm 04:54 PM
DeepSeek is a powerful intelligent search and analysis tool that provides two access methods: web version and official website. The web version is convenient and efficient, and can be used without installation; the official website provides comprehensive product information, download resources and support services. Whether individuals or corporate users, they can easily obtain and analyze massive data through DeepSeek to improve work efficiency, assist decision-making and promote innovation.
 How to install deepseek
Feb 19, 2025 pm 05:48 PM
There are many ways to install DeepSeek, including: compile from source (for experienced developers) using precompiled packages (for Windows users) using Docker containers (for most convenient, no need to worry about compatibility) No matter which method you choose, Please read the official documents carefully and prepare them fully to avoid unnecessary trouble.
 BitPie Bitpie wallet app download address
Sep 10, 2024 pm 12:10 PM
How to download BitPie Bitpie Wallet App? The steps are as follows: Search for "BitPie Bitpie Wallet" in the AppStore (Apple devices) or Google Play Store (Android devices). Click the "Get" or "Install" button to download the app. For the computer version, visit the official BitPie wallet website and download the corresponding software package.
 BITGet official website installation (2025 beginner's guide)
Feb 21, 2025 pm 08:42 PM
BITGet is a cryptocurrency exchange that provides a variety of trading services including spot trading, contract trading and derivatives. Founded in 2018, the exchange is headquartered in Singapore and is committed to providing users with a safe and reliable trading platform. BITGet offers a variety of trading pairs, including BTC/USDT, ETH/USDT and XRP/USDT. Additionally, the exchange has a reputation for security and liquidity and offers a variety of features such as premium order types, leveraged trading and 24/7 customer support.
 Ouyi okx installation package is directly included
Feb 21, 2025 pm 08:00 PM
Ouyi OKX, the world's leading digital asset exchange, has now launched an official installation package to provide a safe and convenient trading experience. The OKX installation package of Ouyi does not need to be accessed through a browser. It can directly install independent applications on the device, creating a stable and efficient trading platform for users. The installation process is simple and easy to understand. Users only need to download the latest version of the installation package and follow the prompts to complete the installation step by step.
 Get the gate.io installation package for free
Feb 21, 2025 pm 08:21 PM
Gate.io is a popular cryptocurrency exchange that users can use by downloading its installation package and installing it on their devices. The steps to obtain the installation package are as follows: Visit the official website of Gate.io, click "Download", select the corresponding operating system (Windows, Mac or Linux), and download the installation package to your computer. It is recommended to temporarily disable antivirus software or firewall during installation to ensure smooth installation. After completion, the user needs to create a Gate.io account to start using it.
 Ouyi Exchange Download Official Portal
Feb 21, 2025 pm 07:51 PM
Ouyi, also known as OKX, is a world-leading cryptocurrency trading platform. The article provides a download portal for Ouyi's official installation package, which facilitates users to install Ouyi client on different devices. This installation package supports Windows, Mac, Android and iOS systems. Users can choose the corresponding version to download according to their device type. After the installation is completed, users can register or log in to the Ouyi account, start trading cryptocurrencies and enjoy other services provided by the platform.


