

How to debug node in vscode


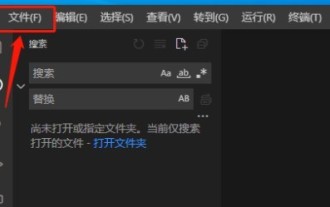
#1. Create a configuration file
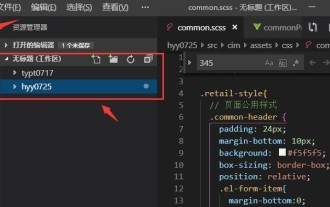
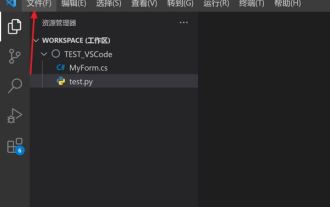
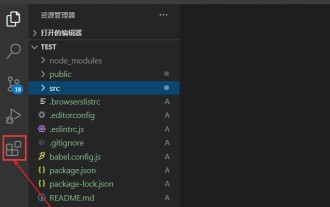
1. Select your project

2. Select the language of your project
3. Generate .vscode/launch.json under the current project path
{
    // Use IntelliSense to learn about possible attributes.
    // Hover to view descriptions of existing attributes.
    // For more information, visit: https://go.microsoft.com/fwlink/?linkid=830387
    "version": "0.2.0",
    "configurations": [
        {
            "type": "node",
            "request": "launch",
            "name": "Launch Program",
            "program": "${workspaceFolder}/test.js"
        }
    ]
}
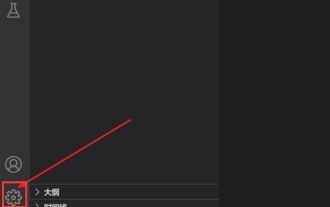
4. Quickly return to your configuration file
2. Breakpoint
1. Breakpoint (traditional breakpoint)
(1) The graphics are replaced by circles;(2) cannot be typed on a blank line.
2. Logpoint
(1) You can print out information in the debug console (wrap expressions with {}); (2) The graphics are replaced by diamonds; (3) If it is not placed on the statement, but on a blank line, it will disappear during debugging and execution, but the effect will not be affected. So it is still recommended to type in the sentence!
3. Conditional Breakpoint
is divided into two conditions: expression/number of hits(1) You can break to the statement closest to the breakpoint when the conditions are met; (2) The graphic is replaced by a square; (3) If you do not hit the statement, but A blank line will disappear during debugging, but will not affect the effect.3. Debugging
#The launch.json configuration file mentioned in Chapter 1 has a request field, and the value range is: launch and attachlaunch: vscode e runs a debugging process independentlyattach: You start debugging by yourself through node --inspect-brk xxx.js, and then vscode attaches itLet’s talk about the difference between specific debugging methods in these two categories:
1. Launch method
(1) Click Launch Program

2. Attach method
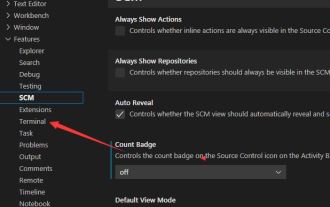
(1) Turn on Auto Attach: On
(2)以调试的方式启动 node
node --inspect-brk test.js
(3)开始调试
四、调试相关功能
1、DEBUG CONSOLE
可以在此操作变量
五、多目标调试
需求:同时调试 server.js 和 client.js
1、建立配置文件
{
    "version": "0.2.0",
    "configurations": [
        {
            "type": "node",
            "request": "launch",
            "name": "Server",
            "program": "${workspaceFolder}/server.js",
            "cwd": "${workspaceFolder}"
        },
        {
            "type": "node",
            "request": "launch",
            "name": "Client",
            "program": "${workspaceFolder}/client.js",
            "cwd": "${workspaceFolder}"
        }
    ],
    "compounds": [
        {
            "name": "Server/Client",
            "configurations": ["Server", "Client"]
        }
    ]
}2、开始调试
注1:调试的时候,可以同时运行程序。
注2:当修改代码,同时运行的程序会立即生效,而调试的代码还是老的。
PHP中文网,有大量免费的vscode入门教程,欢迎大家学习!
The above is the detailed content of How to debug node in vscode. For more information, please follow other related articles on the PHP Chinese website!

Hot AI Tools

Undresser.AI Undress
AI-powered app for creating realistic nude photos

AI Clothes Remover
Online AI tool for removing clothes from photos.

Undress AI Tool
Undress images for free

Clothoff.io
AI clothes remover

AI Hentai Generator
Generate AI Hentai for free.

Hot Article
Hot Tools

Notepad++7.3.1
Easy-to-use and free code editor

SublimeText3 Chinese version
Chinese version, very easy to use

Zend Studio 13.0.1
Powerful PHP integrated development environment

Dreamweaver CS6
Visual web development tools

SublimeText3 Mac version
God-level code editing software (SublimeText3)
Hot Topics
 1377
1377
 52
52

 How to add files to vscode workspace How to add files to vscode workspace
May 09, 2024 am 09:43 AM
How to add files to vscode workspace How to add files to vscode workspace
May 09, 2024 am 09:43 AM
1. First, open the vscode software, click the explorer icon, and find the workspace window 2. Then, click the file menu in the upper left corner and find the add folder to workspace option 3. Finally, find the folder location in the local disk , click the add button
 How to enable background updates in vscode How to enable background updates in vscode
May 09, 2024 am 09:52 AM
How to enable background updates in vscode How to enable background updates in vscode
May 09, 2024 am 09:52 AM
1. First, after opening the interface, click the file menu in the upper left corner. 2. Then, click the settings button in the preferences column. 3. Then, in the settings page that jumps, find the update section. 4. Finally, click the mouse to check and enable it. Download and install the new VSCode version button in the background on Windows and restart the program.
 How to disable wsl configuration file in vscode How to disable wsl configuration file in vscode
May 09, 2024 am 10:30 AM
How to disable wsl configuration file in vscode How to disable wsl configuration file in vscode
May 09, 2024 am 10:30 AM
1. First, open the settings option in the settings menu. 2. Then, find the terminal column in the commonly used page. 3. Finally, uncheck the usewslprofiles button on the right side of the column.
 How to set animation smooth insertion in VScode VScode tutorial to set animation smooth insertion
May 09, 2024 am 09:49 AM
How to set animation smooth insertion in VScode VScode tutorial to set animation smooth insertion
May 09, 2024 am 09:49 AM
1. First, after opening the interface, click the workspace interface 2. Then, in the open editing panel, click the File menu 3. Then, click the Settings button under the Preferences column 4. Finally, click the mouse to check the CursorSmoothCaretAnimation button and save Just set it
 How to open workspace trust permissions in Vscode Vscode method to open workspace trust permissions
May 09, 2024 am 10:34 AM
How to open workspace trust permissions in Vscode Vscode method to open workspace trust permissions
May 09, 2024 am 10:34 AM
1. First, after opening the editing window, click the configuration icon in the lower left corner 2. Then, click the Manage Workspace Trust button in the submenu that opens 3. Then, find the page in the editing window 4. Finally, according to your office Just check the relevant instructions if required
 How to use LeakSanitizer to debug C++ memory leaks?
Jun 02, 2024 pm 09:46 PM
How to use LeakSanitizer to debug C++ memory leaks?
Jun 02, 2024 pm 09:46 PM
How to use LeakSanitizer to debug C++ memory leaks? Install LeakSanitizer. Enable LeakSanitizer via compile flag. Run the application and analyze the LeakSanitizer report. Identify memory allocation types and allocation locations. Fix memory leaks and ensure all dynamically allocated memory is released.
 How to open animation in Vscode Introduction to the method of opening animation in Vscode
May 09, 2024 am 10:28 AM
How to open animation in Vscode Introduction to the method of opening animation in Vscode
May 09, 2024 am 10:28 AM
1. First, click to open the settings option in the More menu. 2. Then, find the terminal column under the Features section. 3. Finally, on the right side of the column, click the enableanimation button with the mouse and save the settings.
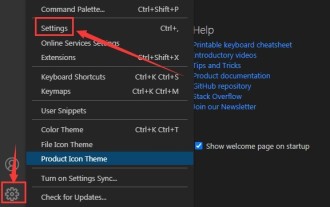
 How to set the file icon theme in vscode_How to set the file icon theme in vscode
May 09, 2024 am 10:00 AM
How to set the file icon theme in vscode_How to set the file icon theme in vscode
May 09, 2024 am 10:00 AM
1. After opening the interface, click the extension button in the lower left corner 2. Search for the vscode-icons plug-in in the extension store and install it 3. Then click the preferences button in the file menu in the upper left corner to find the file icon theme option 4. Find the just installed Just set the plug-in
