How to use visual charts echarts in Vue projects

Let us take a look at the official website first: https://www.echartsjs.com/zh/index.html
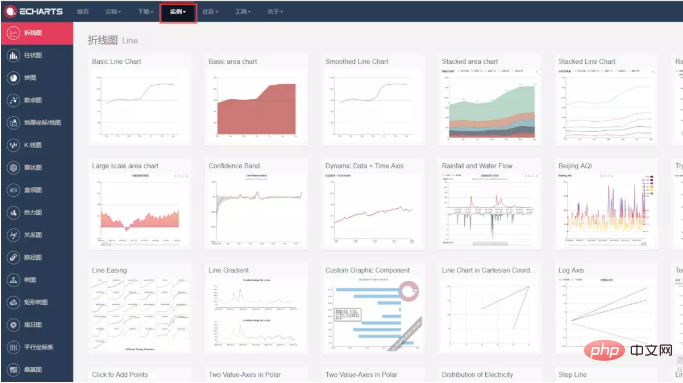
Click For example, you can see various visual charts in the picture above. Select one of the charts:
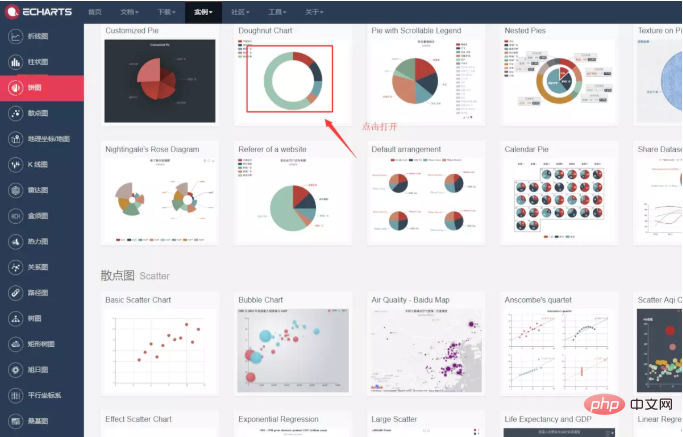
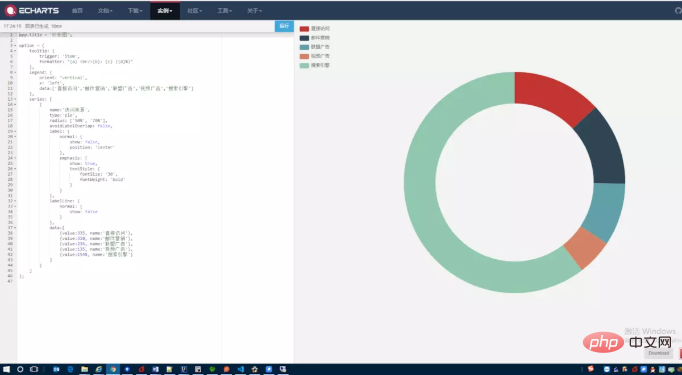
After opening, the code is on the left and the chart on the right:
1 2 3 4 5 6 7 8 9 10 11 12 13 14 15 16 17 18 19 20 21 22 23 24 25 26 27 28 29 30 31 32 33 34 35 36 37 38 39 40 41 42 43 44 45 |
|
Then you only need a few steps to use it:
1. Local installation:
You can use npm to install ECharts:
1 |
|
2. Introduce echarts into index.html
1 |
|
3. Write a div container to host the chart:
1 2 3 |
|
Set a div in the above code (set the height, size and other attributes, set An id)
4. Write a method to initialize the chart code (copy and paste the code from the official website document directly and modify the container id and the values of each part):
1 2 3 4 5 6 7 8 9 10 11 12 13 14 15 16 17 18 19 20 21 22 23 24 25 26 27 28 29 30 31 32 33 34 35 36 37 38 39 40 41 42 43 44 45 46 47 48 |
|
5. Finally, when initializing the page, just call this method and you can see the chart:
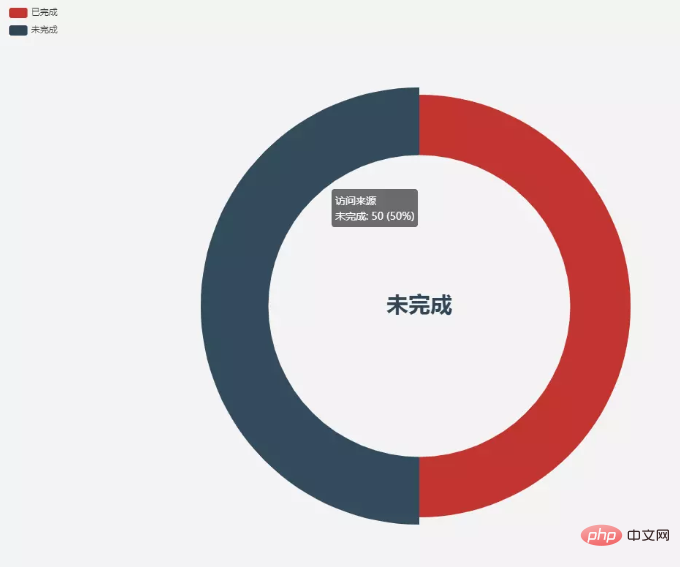
Other charts can be introduced into your own vue project using this method ~
PHP Chinese website has a large number of free JavaScript introductory tutorials, everyone is welcome to learn!
This article is reproduced from: https://www.jianshu.com/p/2894b781063b
The above is the detailed content of How to use visual charts echarts in Vue projects. For more information, please follow other related articles on the PHP Chinese website!

Hot AI Tools

Undresser.AI Undress
AI-powered app for creating realistic nude photos

AI Clothes Remover
Online AI tool for removing clothes from photos.

Undress AI Tool
Undress images for free

Clothoff.io
AI clothes remover

Video Face Swap
Swap faces in any video effortlessly with our completely free AI face swap tool!

Hot Article

Hot Tools

Notepad++7.3.1
Easy-to-use and free code editor

SublimeText3 Chinese version
Chinese version, very easy to use

Zend Studio 13.0.1
Powerful PHP integrated development environment

Dreamweaver CS6
Visual web development tools

SublimeText3 Mac version
God-level code editing software (SublimeText3)

Hot Topics
 How to use bootstrap in vue
Apr 07, 2025 pm 11:33 PM
Using Bootstrap in Vue.js is divided into five steps: Install Bootstrap. Import Bootstrap in main.js. Use the Bootstrap component directly in the template. Optional: Custom style. Optional: Use plug-ins.
 How to add functions to buttons for vue
Apr 08, 2025 am 08:51 AM
You can add a function to the Vue button by binding the button in the HTML template to a method. Define the method and write function logic in the Vue instance.
 How to use watch in vue
Apr 07, 2025 pm 11:36 PM
The watch option in Vue.js allows developers to listen for changes in specific data. When the data changes, watch triggers a callback function to perform update views or other tasks. Its configuration options include immediate, which specifies whether to execute a callback immediately, and deep, which specifies whether to recursively listen to changes to objects or arrays.
 What does vue multi-page development mean?
Apr 07, 2025 pm 11:57 PM
Vue multi-page development is a way to build applications using the Vue.js framework, where the application is divided into separate pages: Code Maintenance: Splitting the application into multiple pages can make the code easier to manage and maintain. Modularity: Each page can be used as a separate module for easy reuse and replacement. Simple routing: Navigation between pages can be managed through simple routing configuration. SEO Optimization: Each page has its own URL, which helps SEO.
 How to reference js file with vue.js
Apr 07, 2025 pm 11:27 PM
There are three ways to refer to JS files in Vue.js: directly specify the path using the <script> tag;; dynamic import using the mounted() lifecycle hook; and importing through the Vuex state management library.
 How to return to previous page by vue
Apr 07, 2025 pm 11:30 PM
Vue.js has four methods to return to the previous page: $router.go(-1)$router.back() uses <router-link to="/" component window.history.back(), and the method selection depends on the scene.
 How to use vue traversal
Apr 07, 2025 pm 11:48 PM
There are three common methods for Vue.js to traverse arrays and objects: the v-for directive is used to traverse each element and render templates; the v-bind directive can be used with v-for to dynamically set attribute values for each element; and the .map method can convert array elements into new arrays.
 How to jump to the div of vue
Apr 08, 2025 am 09:18 AM
There are two ways to jump div elements in Vue: use Vue Router and add router-link component. Add the @click event listener and call this.$router.push() method to jump.


