How to debug vue with vscode

How to debug vue with vscode?
Use VS Code breakpoint debugging
It is inconvenient to debug Vue code directly in the debugging window of Chrome. Fortunately, Visual Studio Code provides Debugger. for Chrome plug-in, you can debug the code directly in the VS Code breakpoint through configuration, and see the same value as the console in Chrome in the debugging window of VS Code. This article will introduce the configuration process.
Related recommendations: vscode tutorial
1. Open the Chrome remote debugging port
First we need to start Chrome with remote debugging turned on, so VS Code can be attached to Chrome.
Windows
Right-click the Chrome shortcut icon, select Properties
In the target column, add --remote-debugging-port=9222 at the end, pay attention to use Separate by spaces
macOS
Open the console
Execute the command /Applications/Google\ Chrome.app/Contents/MacOS/Google\ Chrome --remote-debugging-port =9222
Linux
Open the console
Execute the command google-chrome --remote-debugging-port=9222
2. Install the Chrome Debug plug-in
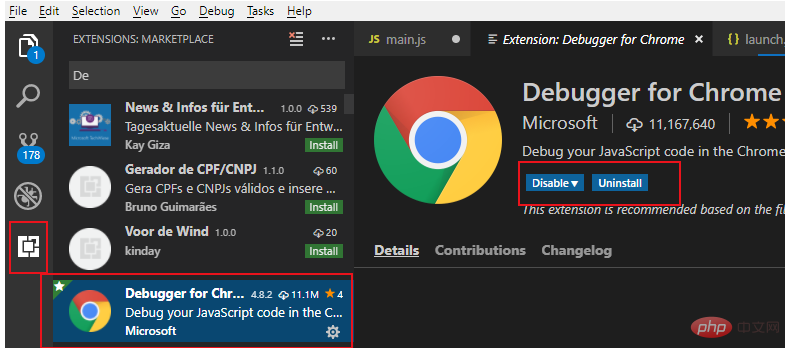
Click the extension button in the left sidebar of Visual Studio Code, then enter Debugger for Chrome in the search box and install the plug-in, enter it again, and click reload to restart after the installation is complete.
3. Create a Debug configuration file
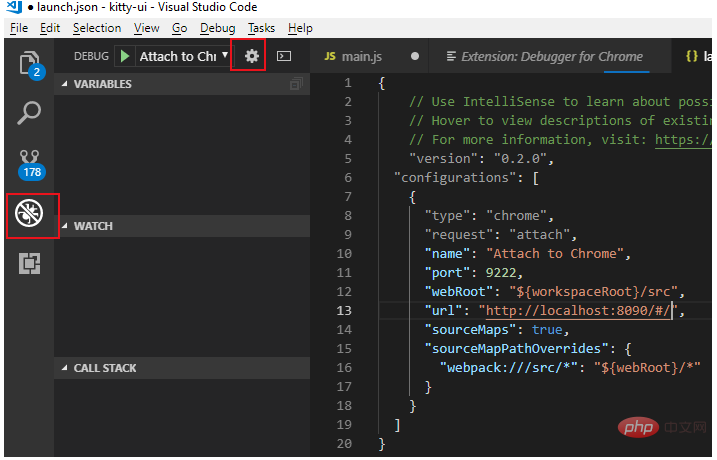
Click the debug button in the left sidebar of Visual Studio Code, and click the settings pinion in the pop-up debugging configuration window. Then select chrome, VS Code will generate a .vscode directory in the root directory of the workspace. There will be a lanch.json file in it and it will be opened automatically.
Use the following configuration file to overwrite the contents of the automatically generated lanch.json file. .
Note: The port number in the URL must be consistent with the startup port number configured by WEBPACK.
{
  // Use IntelliSense to learn about possible attributes.
  // Hover to view descriptions of existing attributes.
  // For more information, visit: https://go.microsoft.com/fwlink/?linkid=830387
  "version": "0.2.0",
  "configurations": [
    {
      "type": "chrome",
      "request": "attach",
      "name": "Attach to Chrome",
      "port": 9222,
      "webRoot": "${workspaceRoot}/src",
      "url": "http://localhost:8080/#/",
      "sourceMaps": true,
      "sourceMapPathOverrides": {
        "webpack:///src/*": "${webRoot}/*"
      }
    }
  ]
}
4. Modify the webpack configuration
If it is a vue project packaged based on webpack, there may be a problem of breakpoint mismatch, and you still need to do something Modification:
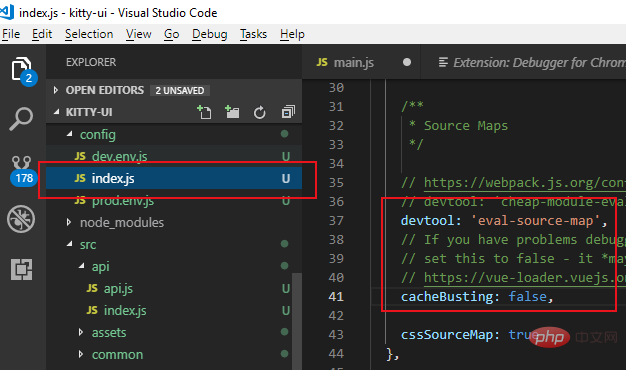
1. Open the index.js file in the config directory in the root directory
2. Change the devtool value under the dev node to 'eval-source-map'
3. Change the cacheBusting value under the dev node to false
5. Turn on debugging
After the above configuration is completed :
1. Open Chrome with remote debugging through the first step
2. Execute npm run dev in the vue project to start the project in debugging mode
3. Click the debug button in the left sidebar of VS Code, select Attach to Chrome and click the green start button. The debugging control bar will appear under normal circumstances.
Now you can debug breakpoints in the js code of the vue file.
The above is the detailed content of How to debug vue with vscode. For more information, please follow other related articles on the PHP Chinese website!

Hot AI Tools

Undresser.AI Undress
AI-powered app for creating realistic nude photos

AI Clothes Remover
Online AI tool for removing clothes from photos.

Undress AI Tool
Undress images for free

Clothoff.io
AI clothes remover

AI Hentai Generator
Generate AI Hentai for free.

Hot Article

Hot Tools

Notepad++7.3.1
Easy-to-use and free code editor

SublimeText3 Chinese version
Chinese version, very easy to use

Zend Studio 13.0.1
Powerful PHP integrated development environment

Dreamweaver CS6
Visual web development tools

SublimeText3 Mac version
God-level code editing software (SublimeText3)

Hot Topics
 1378
1378
 52
52
 How to view word documents in vscode How to view word documents in vscode
May 09, 2024 am 09:37 AM
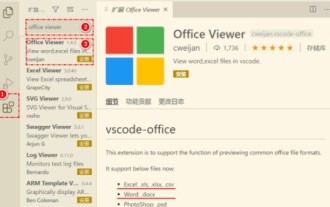
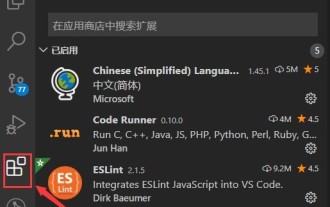
First, open the vscode software on the computer, click the [Extension] icon on the left, as shown in ① in the figure. Then, enter [officeviewer] in the search box of the extension interface, as shown in ② in the figure. Then, from the search Select [officeviewer] to install in the results, as shown in ③ in the figure. Finally, open the file, such as docx, pdf, etc., as shown below
 How to draw a flow chart with vscode_How to draw a flow chart with visual_studio code
Apr 23, 2024 pm 02:13 PM
First, open visual studio code on the computer, click the four square buttons on the left, then enter draw.io in the search box to query the plug-in, click Install. After installation, create a new test.drawio file, then select the test.drawio file, enter the editing mode on the left There are various graphics on the side. You can draw the flow chart by selecting at will. After drawing, click File → Embed → svg and then select Embed. Copy the svg code. Paste the copied svg code into the html code. Open the html web page and you can see it. Click on the picture on the web page to jump to the flow chart. On this page, you can zoom in and out of the flow chart. Here, we choose to click on the pencil pattern in the lower right corner to jump to the web page.
 Caltech Chinese use AI to subvert mathematical proofs! Speed up 5 times shocked Tao Zhexuan, 80% of mathematical steps are fully automated
Apr 23, 2024 pm 03:01 PM
LeanCopilot, this formal mathematics tool that has been praised by many mathematicians such as Terence Tao, has evolved again? Just now, Caltech professor Anima Anandkumar announced that the team released an expanded version of the LeanCopilot paper and updated the code base. Image paper address: https://arxiv.org/pdf/2404.12534.pdf The latest experiments show that this Copilot tool can automate more than 80% of the mathematical proof steps! This record is 2.3 times better than the previous baseline aesop. And, as before, it's open source under the MIT license. In the picture, he is Song Peiyang, a Chinese boy. He is
 How to enable background updates in vscode How to enable background updates in vscode
May 09, 2024 am 09:52 AM
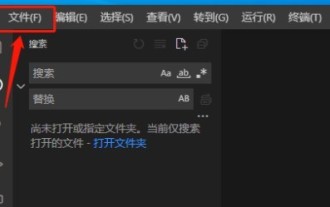
1. First, after opening the interface, click the file menu in the upper left corner. 2. Then, click the settings button in the preferences column. 3. Then, in the settings page that jumps, find the update section. 4. Finally, click the mouse to check and enable it. Download and install the new VSCode version button in the background on Windows and restart the program.
 How to add files to vscode workspace How to add files to vscode workspace
May 09, 2024 am 09:43 AM
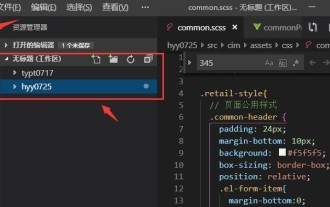
1. First, open the vscode software, click the explorer icon, and find the workspace window 2. Then, click the file menu in the upper left corner and find the add folder to workspace option 3. Finally, find the folder location in the local disk , click the add button
 How to disable wsl configuration file in vscode How to disable wsl configuration file in vscode
May 09, 2024 am 10:30 AM
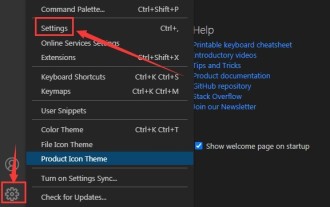
1. First, open the settings option in the settings menu. 2. Then, find the terminal column in the commonly used page. 3. Finally, uncheck the usewslprofiles button on the right side of the column.
 How to set animation smooth insertion in VScode VScode tutorial to set animation smooth insertion
May 09, 2024 am 09:49 AM
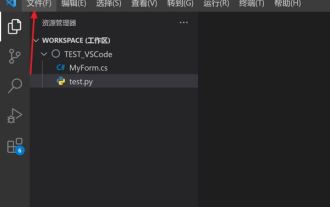
1. First, after opening the interface, click the workspace interface 2. Then, in the open editing panel, click the File menu 3. Then, click the Settings button under the Preferences column 4. Finally, click the mouse to check the CursorSmoothCaretAnimation button and save Just set it
 How to open workspace trust permissions in Vscode Vscode method to open workspace trust permissions
May 09, 2024 am 10:34 AM
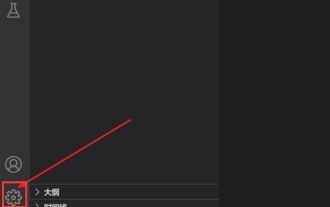
1. First, after opening the editing window, click the configuration icon in the lower left corner 2. Then, click the Manage Workspace Trust button in the submenu that opens 3. Then, find the page in the editing window 4. Finally, according to your office Just check the relevant instructions if required


