
In the newly created Excel data table, create two rows of data for analysis.
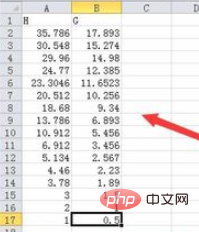
Select all data and click the data analysis option in the data menu item.
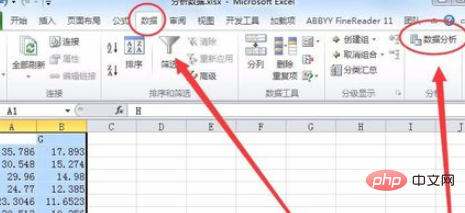
#By default, Excel tables do not have data analysis options, you need to add it at this time.
Click the option in the File menu, as shown below:

In the Excel options, select the add-in option
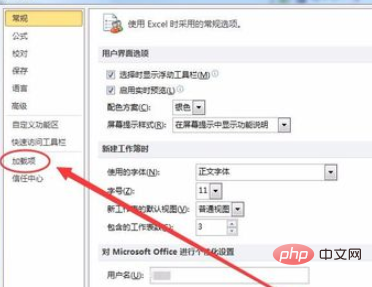
In the add-in, select the Analysis ToolPak option and click OK

Then, return to the data form and open the data analysis option
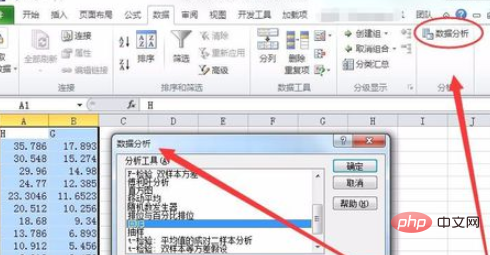
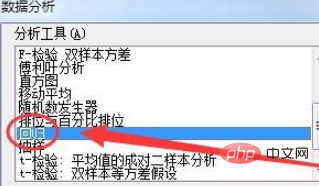
In the data analysis dialog box, select the regression option
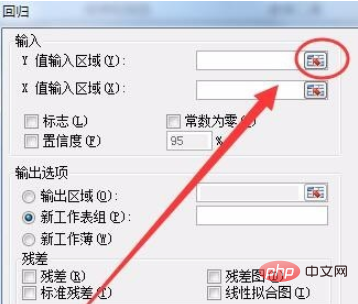
Click the button behind the Y input area, as shown below:
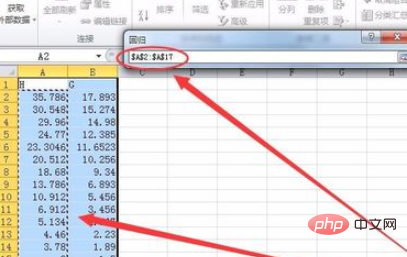
Select the Y data area in the window that appears. I selected the A2:A17 area
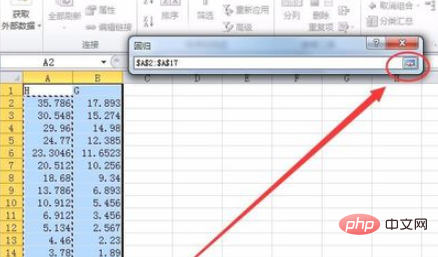
Click The button behind regression returns to the regression dialog box, as shown in the following figure:
Use the method of selecting the Y value input area to select the X value input area. In this example, select The area of the
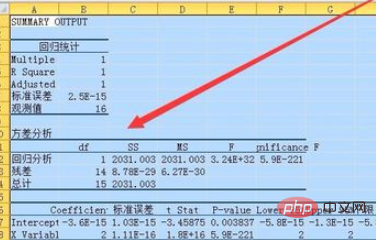
Excel will create a new data table, which displays various analysis results, such as standard errors, observed values, regression analysis, residuals, etc., and also displays observed values, predictions, and residual tables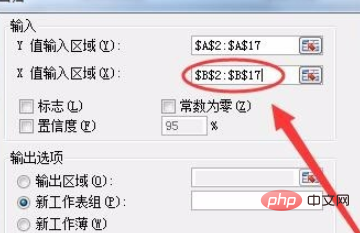
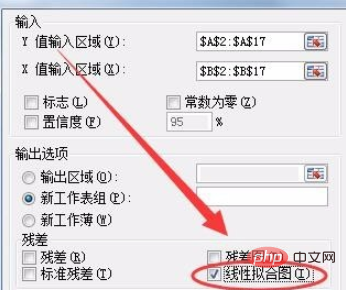
On the right side of the table, the linear fitting plot will be displayed
We can Select the table and change the style of the table in Chart Style and Chart Layout in the Design menu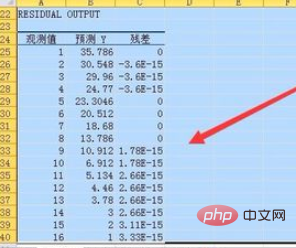
Recommended related article tutorials: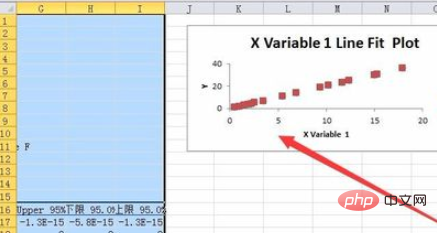 excel tutorial
The above is the detailed content of How to use excel to do univariate characteristic regression analysis. For more information, please follow other related articles on the PHP Chinese website!
 Compare the similarities and differences between two columns of data in excel
 excel duplicate item filter color
 How to copy an Excel table to make it the same size as the original
 Excel table slash divided into two
 Excel diagonal header is divided into two
 Absolute reference input method
 java export excel
 Excel input value is illegal


