What to do if vscode lua breakpoint fails

What should I do if the lua breakpoint fails in vscode?
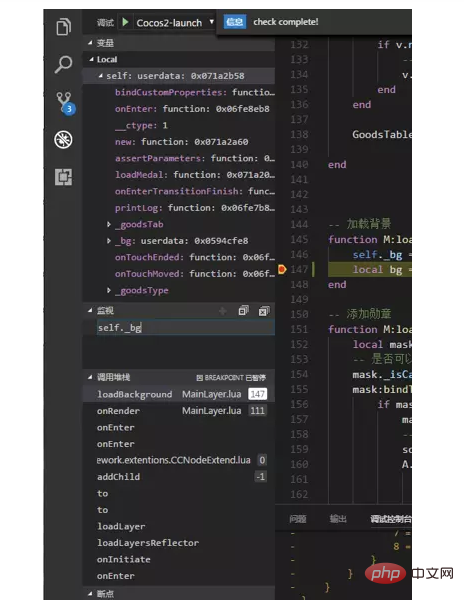
Using VSCode breakpoints to debug Lua tutorial
1. Install Visual Studio Code (vscode) and search and install luaide in the Plug-in Center
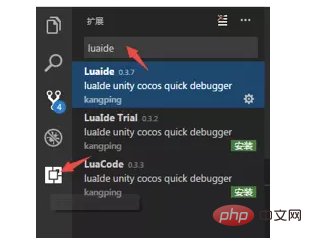
2. Configure luach.json
1. Drag the project folder directly into vscode
2. Debug icon in the left column->Settings-> ;Select LuaDebug, and the launch.json file will appear
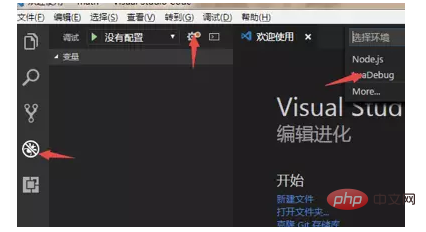
3. Find the exePath field in the launch.json file and modify it to the simulator path
For example : "exePath": "D:/xxx/player-3.x/player3.exe",
Just configure the default in other places.
三.lua breakpoint debugging configuration
1. Download the file LuaDebug.lua
Address: https://github.com/k0204/LuaIde
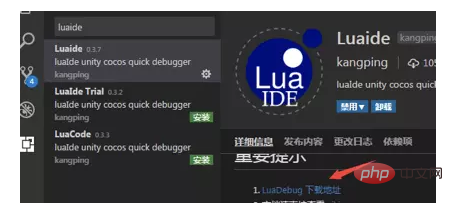
2. Place the LuaDebug.lua file in the project src directory
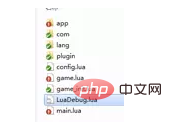
3. Add debugging code
Add the following code in the main.lua file:
        local breakInfoFun,xpcallFun = require("LuaDebug")("localhost", 7003)

            --3.x
            --1.断点定时器添加
            cc.Director:getInstance():getScheduler():scheduleScriptFunc(breakInfoFun, 0.3, false)
            --2.程序异常监听
            function G__TRACKBACK(errorMessage)
            debugXpCall();
            print("----------------------------------------")
            local msg = debug.traceback(errorMessage, 3)
            print(msg)
            print("----------------------------------------")
            end
            local status, msg = xpcall(main, G__TRACKBACK)
            --如果是2.x
            CCDirector:sharedDirector():getScheduler():scheduleScriptFunc(breakInfoFun, 0.3, false)
            function G__TRACKBACK(errorMessage)
            debugXpCall();
            print("----------------------------------------")
            local msg = debug.traceback(errorMessage, 3)
            print(msg)
            print("----------------------------------------")
            end
            local status, msg = xpcall(main, G__TRACKBACK)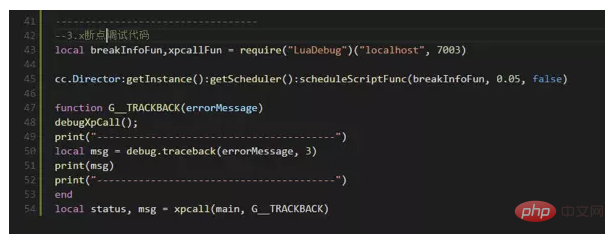


The above is the detailed content of What to do if vscode lua breakpoint fails. For more information, please follow other related articles on the PHP Chinese website!

Hot AI Tools

Undresser.AI Undress
AI-powered app for creating realistic nude photos

AI Clothes Remover
Online AI tool for removing clothes from photos.

Undress AI Tool
Undress images for free

Clothoff.io
AI clothes remover

Video Face Swap
Swap faces in any video effortlessly with our completely free AI face swap tool!

Hot Article

Hot Tools

Notepad++7.3.1
Easy-to-use and free code editor

SublimeText3 Chinese version
Chinese version, very easy to use

Zend Studio 13.0.1
Powerful PHP integrated development environment

Dreamweaver CS6
Visual web development tools

SublimeText3 Mac version
God-level code editing software (SublimeText3)

Hot Topics
 How to define header files for vscode
Apr 15, 2025 pm 09:09 PM
How to define header files using Visual Studio Code? Create a header file and declare symbols in the header file using the .h or .hpp suffix name (such as classes, functions, variables) Compile the program using the #include directive to include the header file in the source file. The header file will be included and the declared symbols are available.
 What computer configuration is required for vscode
Apr 15, 2025 pm 09:48 PM
VS Code system requirements: Operating system: Windows 10 and above, macOS 10.12 and above, Linux distribution processor: minimum 1.6 GHz, recommended 2.0 GHz and above memory: minimum 512 MB, recommended 4 GB and above storage space: minimum 250 MB, recommended 1 GB and above other requirements: stable network connection, Xorg/Wayland (Linux)
 How to solve the problem of vscode Chinese annotations becoming question marks
Apr 15, 2025 pm 11:36 PM
How to solve the problem that Chinese comments in Visual Studio Code become question marks: Check the file encoding and make sure it is "UTF-8 without BOM". Change the font to a font that supports Chinese characters, such as "Song Style" or "Microsoft Yahei". Reinstall the font. Enable Unicode support. Upgrade VSCode, restart the computer, and recreate the source file.
 How to use VSCode
Apr 15, 2025 pm 11:21 PM
Visual Studio Code (VSCode) is a cross-platform, open source and free code editor developed by Microsoft. It is known for its lightweight, scalability and support for a wide range of programming languages. To install VSCode, please visit the official website to download and run the installer. When using VSCode, you can create new projects, edit code, debug code, navigate projects, expand VSCode, and manage settings. VSCode is available for Windows, macOS, and Linux, supports multiple programming languages and provides various extensions through Marketplace. Its advantages include lightweight, scalability, extensive language support, rich features and version
 Common commands for vscode terminal
Apr 15, 2025 pm 10:06 PM
Common commands for VS Code terminals include: Clear the terminal screen (clear), list the current directory file (ls), change the current working directory (cd), print the current working directory path (pwd), create a new directory (mkdir), delete empty directory (rmdir), create a new file (touch) delete a file or directory (rm), copy a file or directory (cp), move or rename a file or directory (mv) display file content (cat) view file content and scroll (less) view file content only scroll down (more) display the first few lines of the file (head)
 vscode terminal usage tutorial
Apr 15, 2025 pm 10:09 PM
vscode built-in terminal is a development tool that allows running commands and scripts within the editor to simplify the development process. How to use vscode terminal: Open the terminal with the shortcut key (Ctrl/Cmd). Enter a command or run the script. Use hotkeys (such as Ctrl L to clear the terminal). Change the working directory (such as the cd command). Advanced features include debug mode, automatic code snippet completion, and interactive command history.
 How to switch Chinese mode with vscode
Apr 15, 2025 pm 11:39 PM
VS Code To switch Chinese mode: Open the settings interface (Windows/Linux: Ctrl, macOS: Cmd,) Search for "Editor: Language" settings Select "Chinese" in the drop-down menu Save settings and restart VS Code
 vscode Previous Next Shortcut Key
Apr 15, 2025 pm 10:51 PM
VS Code One-step/Next step shortcut key usage: One-step (backward): Windows/Linux: Ctrl ←; macOS: Cmd ←Next step (forward): Windows/Linux: Ctrl →; macOS: Cmd →


