
In daily work, we often filter our data tables. If we want to perform statistics on the filtered data, we need the statistical function provided by Excel—SUBTOTAL, which is The only function that can count cells visible to the user.
Syntax: SUBTOTAL(function_num,ref1,ref2, ...)
Function_num is a number between 1 and 11 (including hidden values) or 101 and 111 (ignoring hidden values), Specifies what function to use for subtotal calculations in lists. The ref1...refn parameters are the 1st to 29th named ranges or references for which subtotal calculations are to be performed. Must be a reference to a range of cells.
Function_num (including hidden values) is a natural number between 1 and 11, used to specify the function used in classification summary calculation
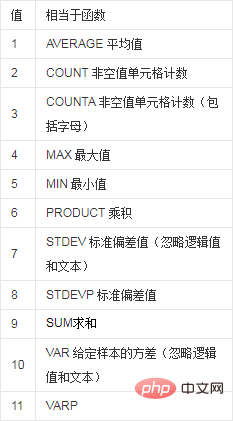
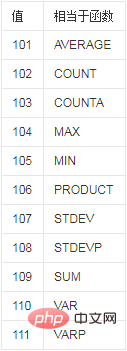
The meaning of each Functiong_num in SUBTOTAL
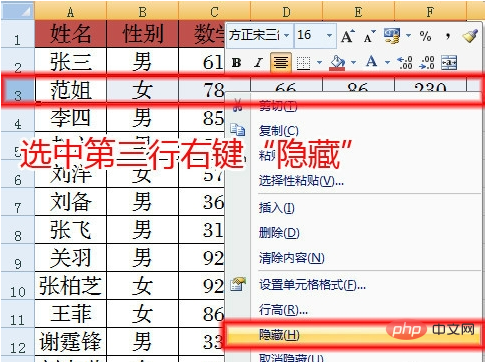
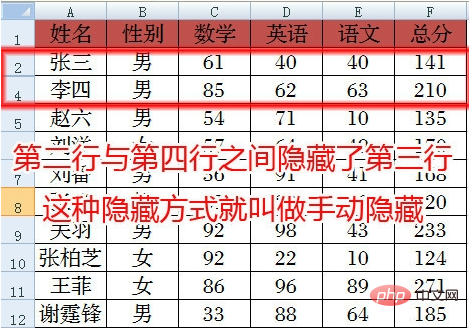
The following explanations are shown by ignoring the manually hidden 101-111. We have the Excel table as shown below. All our functions will be explained based on this table.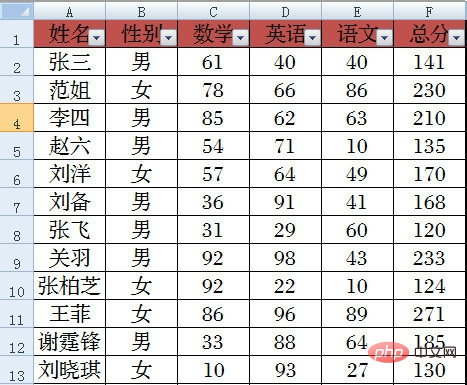
101——AVERAGE
We seek the “English” scores of the “male” students in the data table average. We first screen the "male" students in the "Gender" column.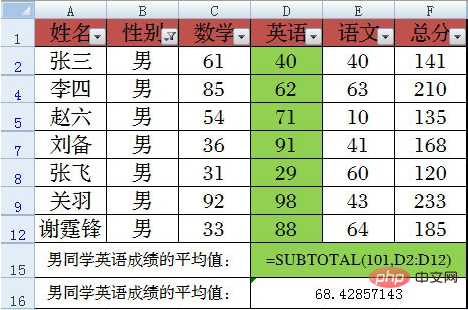
102—COUNT (count the number of cells containing numbers)
We seek the number of "male" students in the data table Number of people with "mathematics" scores. We first screen the "male" students in the "Gender" column.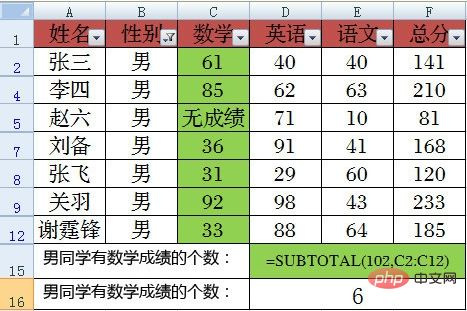
103—COUNTA (statistics include the number of non-empty cells)
We seek the number of "male" students in the data table Number of people with "mathematics" scores. We first screen the "male" students in the "Gender" column. If we use COUNTA here, the results will be wrong.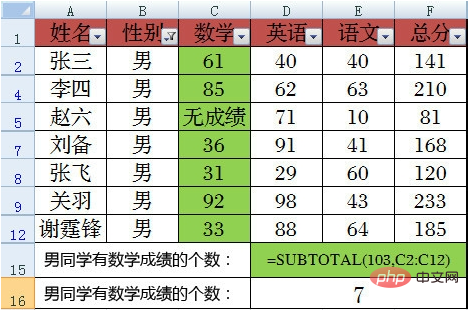
104—MAX (statistical maximum value)
We seek the "total score" of the "female" students in the data table "Highest" grade. We first screen "female" students in the "Gender" column.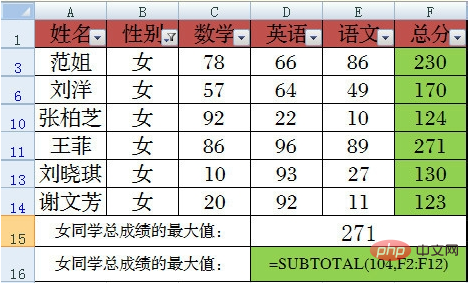
105—MIN (statistical minimum value)
We seek the "total score" of the "female" students in the data table "Minimum" grade. We first screen "female" students in the "Gender" column.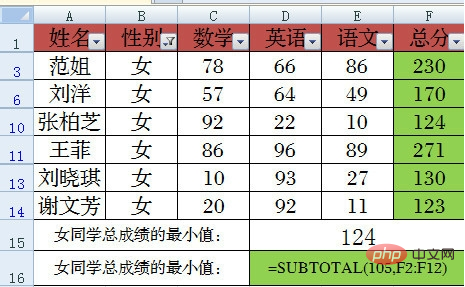
106—PRODUCT (statistics the product of all values in the visible cells)
107—STDEV (visible cells The estimate in the cell is based on the standard deviation of the given sample)
##108—STDEVP (The calculation in the visible cell is based on the standard deviation of the given sample population)110—VAR (the variance in the visible cell is estimated based on the given sample)
111—VARP (the variance in the visible cell is calculated based on the given sample population)
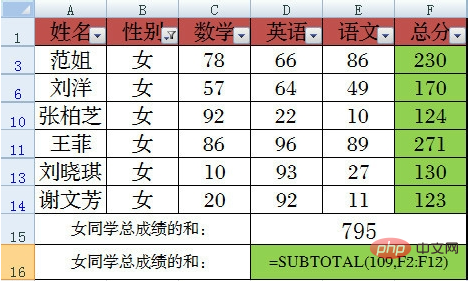
109—SUM (Statistical Sum)
We find the "sum" in the "total score" of the "female" students in the data table. We first screen "female" students in the "Gender" column.
PHP Chinese website has a large number of free Excel tutorials, everyone is welcome to learn!
The above is the detailed content of What do the usage methods of subtotal function 1-9 mean?. For more information, please follow other related articles on the PHP Chinese website!


