How to debug vscode with breakpoints

1. Open the Chrome remote debugging port
First we need to start Chrome with remote debugging turned on so that VS Code can attach to on Chrome.
Windows
Right-click the Chrome shortcut icon, select Properties in the target column, and finally add --remote-debugging-port=9222, be sure to separate them with spaces
macOS
Open the console
Execute the command/Applications/Google\ Chrome.app /Contents/MacOS/Google\ Chrome --remote-debugging-port=9222
Linux
Open the console to execute the commandgoogle-chrome --remote-debugging-port=9222
2. Install the Chrome Debug plug-in
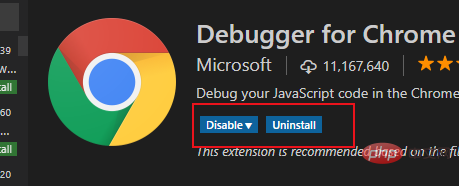
Click the extension button in the left sidebar of Visual Studio Code, and then search Enter Debugger for Chrome in the box and install the plug-in, then enter it again. After the installation is complete, click reload to restart.
#3. Create a Debug configuration file
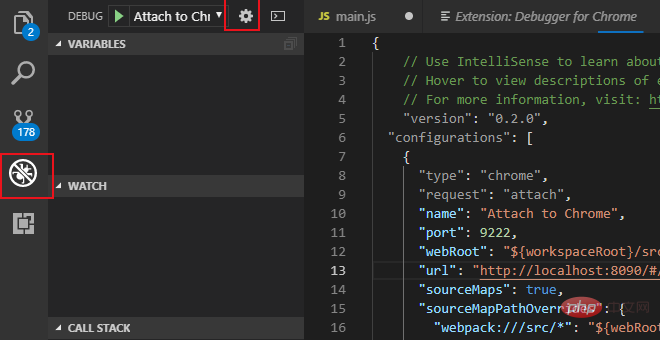
Click the Debug button in the left sidebar of Visual Studio Code, and in the pop-up debug configuration window Click the Settings gear, then select chrome, VS Code will generate a .vscode directory in the root directory of the workspace. There will be a lanch.json file in it and it will automatically open
Use the following configuration file to override the automatic generation lanch.json file contents.
Note: The port number in the URL must be consistent with the startup port number configured by WEBPACK.
{
  // Use IntelliSense to learn about possible attributes.
  // Hover to view descriptions of existing attributes.
  // For more information, visit: https://go.microsoft.com/fwlink/?linkid=830387
  "version": "0.2.0",
  "configurations": [
    {
      "type": "chrome",
      "request": "attach",
      "name": "Attach to Chrome",
      "port": 9222,
      "webRoot": "${workspaceRoot}/src",
      "url": "http://localhost:8080/#/",
      "sourceMaps": true,
      "sourceMapPathOverrides": {
        "webpack:///src/*": "${webRoot}/*"
      }
    }
  ]
}
4. Modify the webpack configuration
If it is a vue project packaged based on webpack, there may be breakpoint mismatches Question, some modifications are needed:
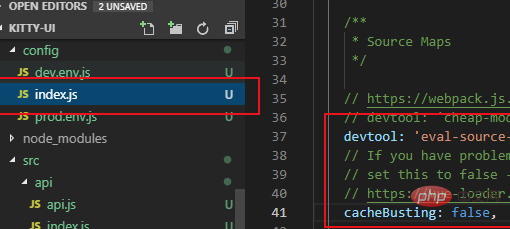
(1) Open the index.js file in the config directory under the root directory
(2) Change the devtool value under the dev node to 'eval -source-map'
(3) Change the cacheBusting value under the dev node to false
##5. Turn on debugging
After the above configuration is completed: (1) Open Chrome with remote debugging in the first step(2) Execute npm run dev in the vue project Start the project in debugging mode (3) Click the debug button on the left sidebar of VS Code, select Attach to Chrome and click the green start button. The debugging control bar will appear under normal circumstances. Now you can debug breakpoints in the js code of the vue file. Recommended related articles and tutorials:The above is the detailed content of How to debug vscode with breakpoints. For more information, please follow other related articles on the PHP Chinese website!

Hot AI Tools

Undresser.AI Undress
AI-powered app for creating realistic nude photos

AI Clothes Remover
Online AI tool for removing clothes from photos.

Undress AI Tool
Undress images for free

Clothoff.io
AI clothes remover

Video Face Swap
Swap faces in any video effortlessly with our completely free AI face swap tool!

Hot Article

Hot Tools

Notepad++7.3.1
Easy-to-use and free code editor

SublimeText3 Chinese version
Chinese version, very easy to use

Zend Studio 13.0.1
Powerful PHP integrated development environment

Dreamweaver CS6
Visual web development tools

SublimeText3 Mac version
God-level code editing software (SublimeText3)

Hot Topics
 1386
1386
 52
52
 How to define header files for vscode
Apr 15, 2025 pm 09:09 PM
How to define header files using Visual Studio Code? Create a header file and declare symbols in the header file using the .h or .hpp suffix name (such as classes, functions, variables) Compile the program using the #include directive to include the header file in the source file. The header file will be included and the declared symbols are available.
 What computer configuration is required for vscode
Apr 15, 2025 pm 09:48 PM
VS Code system requirements: Operating system: Windows 10 and above, macOS 10.12 and above, Linux distribution processor: minimum 1.6 GHz, recommended 2.0 GHz and above memory: minimum 512 MB, recommended 4 GB and above storage space: minimum 250 MB, recommended 1 GB and above other requirements: stable network connection, Xorg/Wayland (Linux)
 How to solve the problem of vscode Chinese annotations becoming question marks
Apr 15, 2025 pm 11:36 PM
How to solve the problem that Chinese comments in Visual Studio Code become question marks: Check the file encoding and make sure it is "UTF-8 without BOM". Change the font to a font that supports Chinese characters, such as "Song Style" or "Microsoft Yahei". Reinstall the font. Enable Unicode support. Upgrade VSCode, restart the computer, and recreate the source file.
 How to switch Chinese mode with vscode
Apr 15, 2025 pm 11:39 PM
VS Code To switch Chinese mode: Open the settings interface (Windows/Linux: Ctrl, macOS: Cmd,) Search for "Editor: Language" settings Select "Chinese" in the drop-down menu Save settings and restart VS Code
 How to set vscode in Chinese
Apr 15, 2025 pm 09:27 PM
There are two ways to set up a Chinese language in Visual Studio Code: 1. Install the Chinese language package; 2. Modify the "locale" settings in the configuration file. Make sure Visual Studio Code version is 1.17 or higher.
 Common commands for vscode terminal
Apr 15, 2025 pm 10:06 PM
Common commands for VS Code terminals include: Clear the terminal screen (clear), list the current directory file (ls), change the current working directory (cd), print the current working directory path (pwd), create a new directory (mkdir), delete empty directory (rmdir), create a new file (touch) delete a file or directory (rm), copy a file or directory (cp), move or rename a file or directory (mv) display file content (cat) view file content and scroll (less) view file content only scroll down (more) display the first few lines of the file (head)
 vscode Previous Next Shortcut Key
Apr 15, 2025 pm 10:51 PM
VS Code One-step/Next step shortcut key usage: One-step (backward): Windows/Linux: Ctrl ←; macOS: Cmd ←Next step (forward): Windows/Linux: Ctrl →; macOS: Cmd →
 How to use VSCode
Apr 15, 2025 pm 11:21 PM
Visual Studio Code (VSCode) is a cross-platform, open source and free code editor developed by Microsoft. It is known for its lightweight, scalability and support for a wide range of programming languages. To install VSCode, please visit the official website to download and run the installer. When using VSCode, you can create new projects, edit code, debug code, navigate projects, expand VSCode, and manage settings. VSCode is available for Windows, macOS, and Linux, supports multiple programming languages and provides various extensions through Marketplace. Its advantages include lightweight, scalability, extensive language support, rich features and version


