How to use debugging with vscode

1. Configure launch.json

#After configuring this, don’t rush to try it, because at this time click the green After starting the start button debugging, I found that the page could not be opened, but there was a prompt that the browser link failed.
At this time, we need to install server plug-ins such as apache and iis to support the page running and displaying in the simulated server.
2. Install the plug-in [Live Server]
This is the plug-in mentioned above that supports the page running in the simulation server, as shown in the picture:
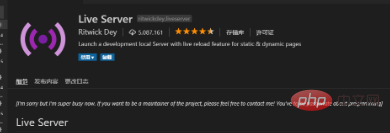
If the installation is completed and there is a [Reload] prompt on the left, click the button to reload.
3. Open the html page and conduct debugging testing
The basic work is ready. At this time, there are two debugging modes:
Use local static page debugging :
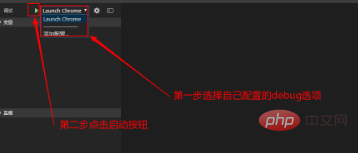
Select the test option you configured, open the page that needs to be debugged, and press F5 to start debugging, as shown in the figure:
Use Debugging in server form:
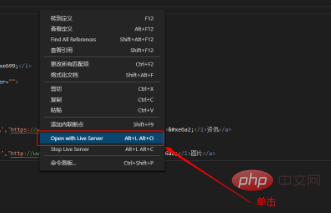
The live server we installed comes in handy at this time. Also open the page to be debugged, right-click anywhere on the page and select "Open with live server". As shown in the picture:
Complete!
Related learning recommendations: vscode tutorial
The above is the detailed content of How to use debugging with vscode. For more information, please follow other related articles on the PHP Chinese website!

Hot AI Tools

Undresser.AI Undress
AI-powered app for creating realistic nude photos

AI Clothes Remover
Online AI tool for removing clothes from photos.

Undress AI Tool
Undress images for free

Clothoff.io
AI clothes remover

AI Hentai Generator
Generate AI Hentai for free.

Hot Article

Hot Tools

Notepad++7.3.1
Easy-to-use and free code editor

SublimeText3 Chinese version
Chinese version, very easy to use

Zend Studio 13.0.1
Powerful PHP integrated development environment

Dreamweaver CS6
Visual web development tools

SublimeText3 Mac version
God-level code editing software (SublimeText3)

Hot Topics
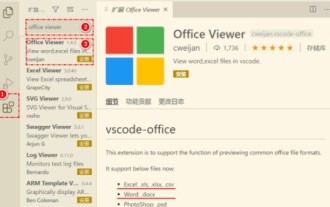 How to view word documents in vscode How to view word documents in vscode
May 09, 2024 am 09:37 AM
First, open the vscode software on the computer, click the [Extension] icon on the left, as shown in ① in the figure. Then, enter [officeviewer] in the search box of the extension interface, as shown in ② in the figure. Then, from the search Select [officeviewer] to install in the results, as shown in ③ in the figure. Finally, open the file, such as docx, pdf, etc., as shown below
 How to enable background updates in vscode How to enable background updates in vscode
May 09, 2024 am 09:52 AM
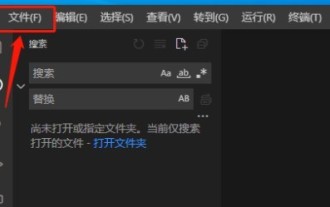
1. First, after opening the interface, click the file menu in the upper left corner. 2. Then, click the settings button in the preferences column. 3. Then, in the settings page that jumps, find the update section. 4. Finally, click the mouse to check and enable it. Download and install the new VSCode version button in the background on Windows and restart the program.
 How to add files to vscode workspace How to add files to vscode workspace
May 09, 2024 am 09:43 AM
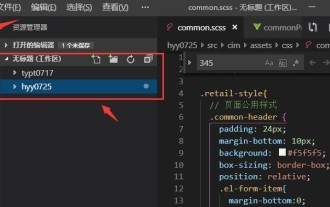
1. First, open the vscode software, click the explorer icon, and find the workspace window 2. Then, click the file menu in the upper left corner and find the add folder to workspace option 3. Finally, find the folder location in the local disk , click the add button
 How to disable wsl configuration file in vscode How to disable wsl configuration file in vscode
May 09, 2024 am 10:30 AM
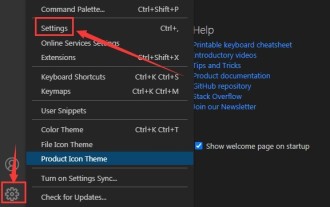
1. First, open the settings option in the settings menu. 2. Then, find the terminal column in the commonly used page. 3. Finally, uncheck the usewslprofiles button on the right side of the column.
 How to set animation smooth insertion in VScode VScode tutorial to set animation smooth insertion
May 09, 2024 am 09:49 AM
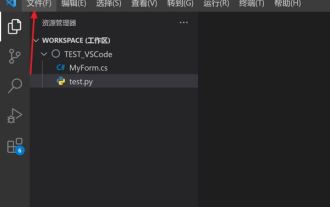
1. First, after opening the interface, click the workspace interface 2. Then, in the open editing panel, click the File menu 3. Then, click the Settings button under the Preferences column 4. Finally, click the mouse to check the CursorSmoothCaretAnimation button and save Just set it
 How to open workspace trust permissions in Vscode Vscode method to open workspace trust permissions
May 09, 2024 am 10:34 AM
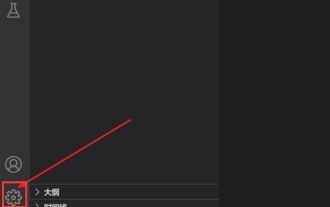
1. First, after opening the editing window, click the configuration icon in the lower left corner 2. Then, click the Manage Workspace Trust button in the submenu that opens 3. Then, find the page in the editing window 4. Finally, according to your office Just check the relevant instructions if required
 How to open animation in Vscode Introduction to the method of opening animation in Vscode
May 09, 2024 am 10:28 AM
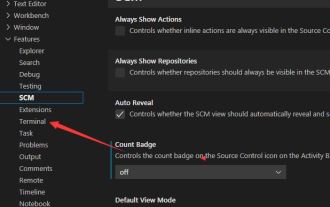
1. First, click to open the settings option in the More menu. 2. Then, find the terminal column under the Features section. 3. Finally, on the right side of the column, click the enableanimation button with the mouse and save the settings.
 How to turn on smart commit in vscode Steps to turn on smart commit in vscode
May 09, 2024 am 10:40 AM
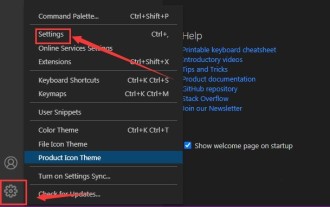
Step 1: After opening the vscode software interface, click the settings button in the settings menu below. Step 2: Find the Git option under the Extensions column. Step 3: Click to check the enablesmartcommit button.


