
Shortcut keys
Ctrl + `  打开默认终端;
Ctrl + Shift + `  新建新的终端;
Ctrl + Shift + Y  打开调试控制台,然后再自行切换终端选项;
ps: ` 在键盘数字1的左边。
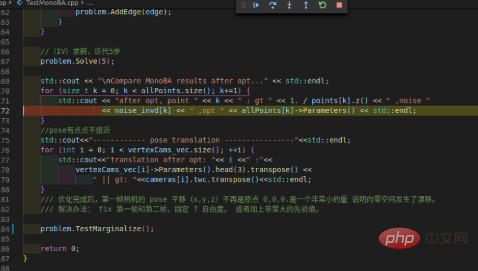
Install clang
sudo apt-get install clang
VScodeDebug
Here is a record of the general cpp debugging of vscode configuration:
1. The overall idea is to first follow the conventional method to perform mkdir build && cd build && cmake.. && make (this One step can be completed in the terminal of vscode, or it can be completed in the system terminal, it doesn't matter. But in order to save the interface, it is better to complete it in vscode) generate the executable file, and then use vscode to perform the single step.
2. Configure the launch file: Click the Debug icon in the left sidebar (Ctrl Shift D), then click the gear icon configure above, and click default configure to automatically generate the launch.json file. Enter the launch file interface and you can see that the path is .vscode/launch.json/Launch Targets/(gbd)Launch.
3. Modify the launch file
{
    "version": "0.2.0",
    "configurations": [
        {
            "name": "(gdb) Launch",
            "type": "cppdbg",
            "request": "launch",
            "program": "${workspaceFolder}/build/app/testMonoBA", //此路径更改为最终生成的可执行文件路径以及可执行文件名称
            "args": [],
            "stopAtEntry": false,
            "cwd": "${workspaceFolder}",
            "environment": [],
            "externalConsole":false,//将此处的true改为false,不然他会调用系统的终端进行现实
            "MIMode": "gdb",
            "setupCommands": [
                {
                    "description": "Enable pretty-printing for gdb",
                    "text": "-enable-pretty-printing",
                    "ignoreFailures": true
                }
            ],
        }
    ]
}4. Modify the CMakeLists.txt file
cmake_minimum_required(VERSION 2.8)
project(slam_demo)

set(DEFAULT_BUILD_TYPE "Debug")  #修改处,讲release改为debug,也可以直接删除
if (NOT CMAKE_BUILD_TYPE)
    message(STATUS "Setting build type to '${DEFAULT_BUILD_TYPE}' as none was specified.")
    set(CMAKE_BUILD_TYPE "${DEFAULT_BUILD_TYPE}" CACHE
            STRING "Choose the type of build." FORCE)
    # Set the possible values of build type for cmake-gui
    set_property(CACHE CMAKE_BUILD_TYPE PROPERTY STRINGS
            "Debug" "Release" "MinSizeRel" "RelWithDebInfo")
endif ()

set(CMAKE_CXX_FLAGS "-std=c++11")

FIND_PACKAGE( OpenMP REQUIRED)
if(OPENMP_FOUND)
    message("OPENMP FOUND")
    ADD_DEFINITIONS(-DUSE_OPENMP)
    set(CMAKE_C_FLAGS "${CMAKE_C_FLAGS} ${OpenMP_C_FLAGS}")
    set(CMAKE_CXX_FLAGS "${CMAKE_CXX_FLAGS} ${OpenMP_CXX_FLAGS}")
    set(CMAKE_EXE_LINKER_FLAGS "${CMAKE_EXE_LINKER_FLAGS} ${OpenMP_EXE_LINKER_FLAGS}")
endif()

#set(CMAKE_CXX_FLAGS_DEBUG "${CMAKE_CXX_FLAGS} -Wno-reorder" CACHE STRING "" FORCE)
#set(CMAKE_CXX_FLAGS_RELEASE "${CMAKE_CXX_FLAGS} -DNDEBUG -Wno-reorder -O2" CACHE STRING "" FORCE)
set(CMAKE_CXX_FLAGS_DEBUG "{CMAKE_CXX_FLAGS} -o0 -ggbd")  #添加语句
add_compile_options(-g)   #添加语句

list(APPEND CMAKE_MODULE_PATH "${PROJECT_SOURCE_DIR}/cmake")

option(BUILD_APPS "Build APPs for slam course" YES)
option(BUILD_TESTS "Build test for slam course" No)

# third party libs
# eigen
find_package(Eigen REQUIRED)
include_directories(${EIGEN_INCLUDE_DIR})

# opencv
find_package(OpenCV 4 REQUIRED)
include_directories(${OpenCV_INCLUDE_DIRS})

# glog
find_package(Glog REQUIRED)
include_directories(${GLOG_INCLUDE_DIRS})


# sophus
include_directories(${PROJECT_SOURCE_DIR}/thirdparty/Sophus)

include_directories(${PROJECT_SOURCE_DIR})

add_subdirectory(frontend)
add_subdirectory(backend)
add_subdirectory(utils)


if (BUILD_APPS)
    add_subdirectory(app)
endif ()

if (BUILD_TESTS)
    enable_testing()
    add_subdirectory(test)
endif ()5. After completing the above steps, recompile, then the debugging column in vscode will no longer be gray and you can perform single-step debugging.

Related recommendations: vscode tutorial
The above is the detailed content of How to use vscode for single-step debugging. For more information, please follow other related articles on the PHP Chinese website!


