vscode debugging c program failed

问题:
执行调试时,出现问题:
无法在".vscode"文件夹(Cannot read property 'name' of undefined) 内创建"launch.json"文件
解决方法:
一、创建文件夹
点击下图中红框处,创建文件夹,命名为“.vscode"

二、创建launch.json
在.vscode文件夹中,创建launch.json文件,并将下面的代码复制进去,其中,miDubuggerPath后的路径为C++编辑器的安装路径
{
    "version": "0.2.0",
    "configurations": [
        {
            "name": "(gdb) Launch", // 配置名称,将会在启动配置的下拉菜单中显示
            "type": "cppdbg", // 配置类型,cppdbg对应cpptools提供的调试功能;可以认为此处只能是cppdbg
            "request": "launch", // 请求配置类型,可以为launch(启动)或attach(附加)
            "program": "${fileDirname}/${fileBasenameNoExtension}.exe", // 将要进行调试的程序的路径
            "args": [], // 程序调试时传递给程序的命令行参数,一般设为空即可
            "stopAtEntry": false, // 设为true时程序将暂停在程序入口处,相当于在main上打断点
            "cwd": "${workspaceFolder}", // 调试程序时的工作目录,此为工作区文件夹;改成${fileDirname}可变为文件所在目录
            "environment": [], // 环境变量
            "externalConsole": false, // 为true时使用单独的cmd窗口,与其它IDE一致;18年10月后设为false可调用VSC内置终端
            "internalConsoleOptions": "neverOpen", // 如果不设为neverOpen,调试时会跳到“调试控制台”选项卡,你应该不需要对gdb手动输命令吧?
            "MIMode": "gdb", // 指定连接的调试器,可以为gdb或lldb。但我没试过lldb
            "miDebuggerPath": "D:\\mingw64\\bin\\gdb.exe", // 调试器路径,Windows下后缀不能省略,Linux下则不要
            "setupCommands": [
                { // 模板自带,好像可以更好地显示STL容器的内容,具体作用自行Google
                    "description": "Enable pretty-printing for gdb",
                    "text": "-enable-pretty-printing",
                    "ignoreFailures": false
                }
            ],
            "preLaunchTask": "Compile" // 调试会话开始前执行的任务,一般为编译程序。与tasks.json的label相对应
        }
    ]
}三、创建tasks.json
在.vscode文件中,新建tasks.json文件,编辑代码
{
    "version": "2.0.0",
    "tasks": [
        {
            "label": "Compile", // 任务名称,与launch.json的preLaunchTask相对应
            "command": "g++", // 要使用的编译器,C++用clang++;如果编译失败,改成gcc或g++试试,还有问题那就是你自己的代码有错误
            "args": [
                "${file}",
                "-o", // 指定输出文件名,不加该参数则默认输出a.exe,Linux下默认a.out
                "${fileDirname}/${fileBasenameNoExtension}.exe",
                "-g", // 生成和调试有关的信息
                "-Wall", // 开启额外警告
                "-static-libgcc", // 静态链接libgcc,一般都会加上
                "-std=c++11", // C++最新标准为c++17,或根据自己的需要进行修改
            ], // 编译命令参数
            "type": "process", // process是vsc把预定义变量和转义解析后直接全部传给command;shell相当于先打开shell再输入命令,所以args还会经过shell再解析一遍
            "group": {
                "kind": "build",
                "isDefault": true // 不为true时ctrl shift B就要手动选择了
            },
            "presentation": {
                "echo": true,
                "reveal": "always", // 执行任务时是否跳转到终端面板,可以为always,silent,never。具体参见VSC的文档
                "focus": false, // 设为true后可以使执行task时焦点聚集在终端,但对编译C/C++来说,设为true没有意义
                "panel": "shared" // 不同的文件的编译信息共享一个终端面板
            },
            // "problemMatcher":"$gcc" // 此选项可以捕捉编译时终端里的报错信息;本文用的是clang,开了可能会出现双重报错信息;只用cpptools可以考虑启用
        }
    ]
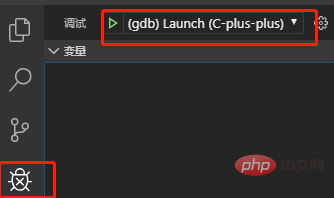
}四、此时点击调试按钮,可以看到出现可以进行调试的选项

相关文章教程推荐:vscode教程
The above is the detailed content of vscode debugging c program failed. For more information, please follow other related articles on the PHP Chinese website!

Hot AI Tools

Undresser.AI Undress
AI-powered app for creating realistic nude photos

AI Clothes Remover
Online AI tool for removing clothes from photos.

Undress AI Tool
Undress images for free

Clothoff.io
AI clothes remover

AI Hentai Generator
Generate AI Hentai for free.

Hot Article

Hot Tools

Notepad++7.3.1
Easy-to-use and free code editor

SublimeText3 Chinese version
Chinese version, very easy to use

Zend Studio 13.0.1
Powerful PHP integrated development environment

Dreamweaver CS6
Visual web development tools

SublimeText3 Mac version
God-level code editing software (SublimeText3)

Hot Topics
 1378
1378
 52
52
 What computer configuration is required for vscode
Apr 15, 2025 pm 09:48 PM
VS Code system requirements: Operating system: Windows 10 and above, macOS 10.12 and above, Linux distribution processor: minimum 1.6 GHz, recommended 2.0 GHz and above memory: minimum 512 MB, recommended 4 GB and above storage space: minimum 250 MB, recommended 1 GB and above other requirements: stable network connection, Xorg/Wayland (Linux)
 How to set vscode
Apr 15, 2025 pm 10:45 PM
To enable and set VSCode, follow these steps: Install and start VSCode. Custom preferences including themes, fonts, spaces, and code formatting. Install extensions to enhance features such as plugins, themes, and tools. Create a project or open an existing project. Use IntelliSense to get code prompts and completions. Debug the code to step through the code, set breakpoints, and check variables. Connect the version control system to manage changes and commit code.
 How to define header files for vscode
Apr 15, 2025 pm 09:09 PM
How to define header files using Visual Studio Code? Create a header file and declare symbols in the header file using the .h or .hpp suffix name (such as classes, functions, variables) Compile the program using the #include directive to include the header file in the source file. The header file will be included and the declared symbols are available.
 vscode running task shortcut key
Apr 15, 2025 pm 09:39 PM
Run tasks in VSCode: Create tasks.json file, specify version and task list; configure the label, command, args, and type of the task; save and reload the task; run the task using the shortcut key Ctrl Shift B (macOS for Cmd Shift B).
 vscode start front-end project command
Apr 15, 2025 pm 10:00 PM
The command to start a front-end project in VSCode is code. The specific steps include: Open the project folder. Start VSCode. Open the project. Enter the startup command code. in the terminal panel. Press Enter to start the project.
 What language is written in vscode
Apr 15, 2025 pm 11:51 PM
VSCode is written in TypeScript and JavaScript. First, its core code base is written in TypeScript, an open source programming language that extends JavaScript and adds type checking capabilities. Secondly, some extensions and plug-ins of VSCode are written in JavaScript. This combination makes VSCode a flexible and extensible code editor.
 vscode terminal usage tutorial
Apr 15, 2025 pm 10:09 PM
vscode built-in terminal is a development tool that allows running commands and scripts within the editor to simplify the development process. How to use vscode terminal: Open the terminal with the shortcut key (Ctrl/Cmd). Enter a command or run the script. Use hotkeys (such as Ctrl L to clear the terminal). Change the working directory (such as the cd command). Advanced features include debug mode, automatic code snippet completion, and interactive command history.
 What language is vscode used
Apr 15, 2025 pm 11:03 PM
Visual Studio Code (VSCode) is developed by Microsoft, built using the Electron framework, and is mainly written in JavaScript. It supports a wide range of programming languages, including JavaScript, Python, C, Java, HTML, CSS, etc., and can add support for other languages through extensions.


