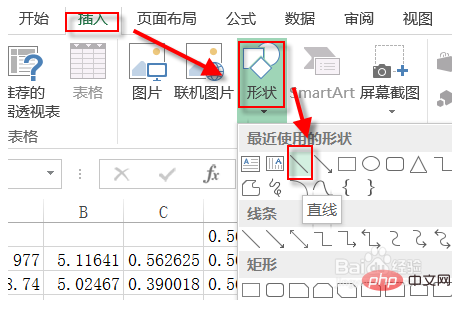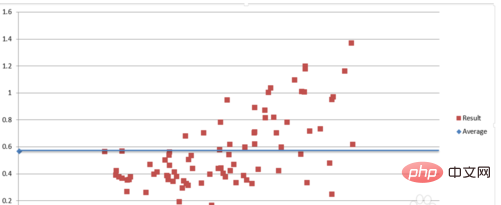
How to add a horizontal line to a scatter chart in Excel?
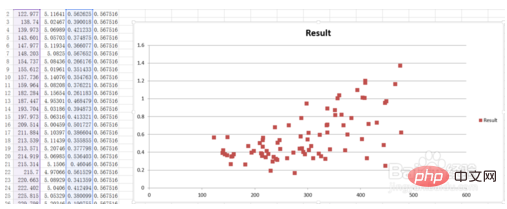
First, add a scatter plot based on the two columns of data

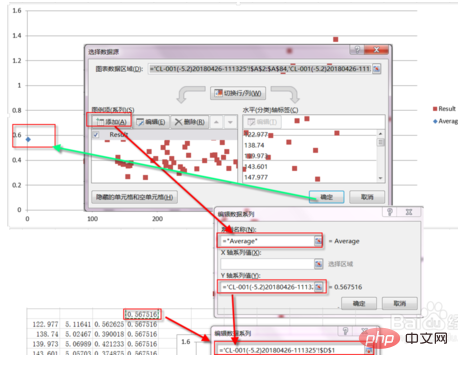
Calculate the average, add a legend item "Average", and add You can see a blue point added in the point diagram


Excel Basic Tutorial column!
The above is the detailed content of How to add a horizontal line to a scatter chart in Excel. For more information, please follow other related articles on the PHP Chinese website!
 Compare the similarities and differences between two columns of data in excel
 excel duplicate item filter color
 How to copy an Excel table to make it the same size as the original
 Excel table slash divided into two
 Excel diagonal header is divided into two
 Absolute reference input method
 java export excel
 Excel input value is illegal


