How to do partial correlation analysis in spss
Calculate the correlation between variables while eliminating the influence of other related factors. It is best to study it together with correlation analysis. Partial correlation analysis is also called net correlation analysis. It analyzes the relationship between two variables while controlling the linear influence of other variables. For linear correlation, the tool used is the partial correlation coefficient.

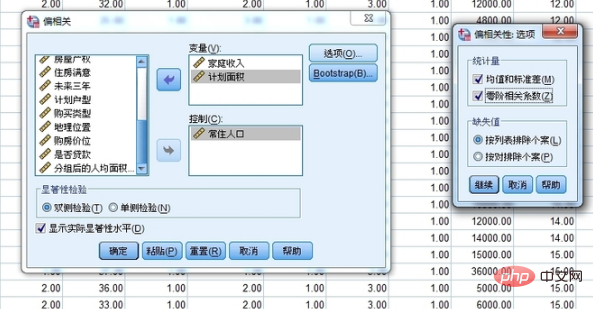
1. First call up the window interface of partial correlation analysis, use "permanent population" as a control variable, and eliminate its correlation with "household income" and "planned area" Analytical impact.


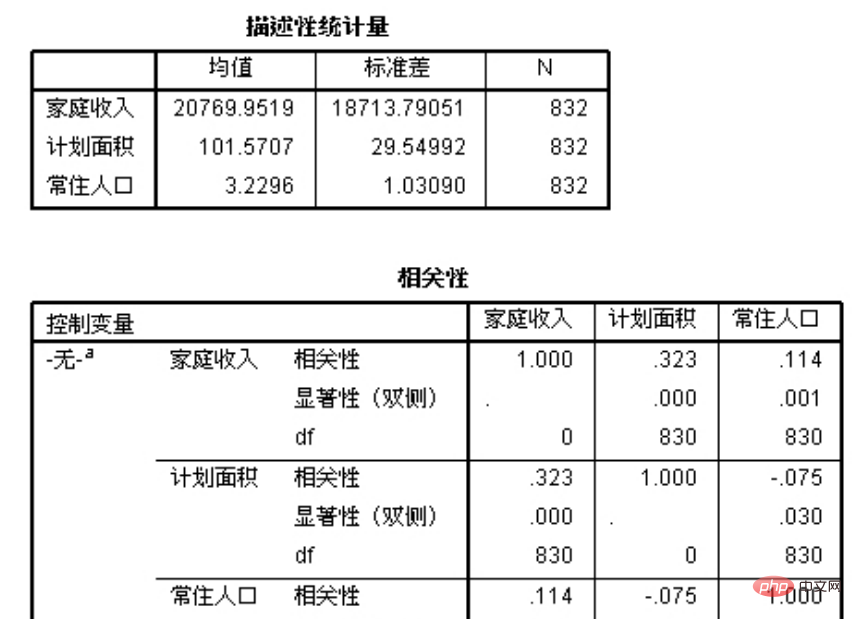
2. Check the "zero-order correlation coefficient" in the "Statistics" option bar, which is the correlation coefficient. In the partial correlation, When the number of control variables is one, the partial correlation coefficient is called the first-order partial correlation coefficient; when the number of control variables is two, it is called the second-order partial correlation coefficient; when it is zero, it is called the zero-order correlation coefficient, which is the correlation coefficient. "Mean and standard deviation' are only descriptive statistics, which will be displayed in the final results.

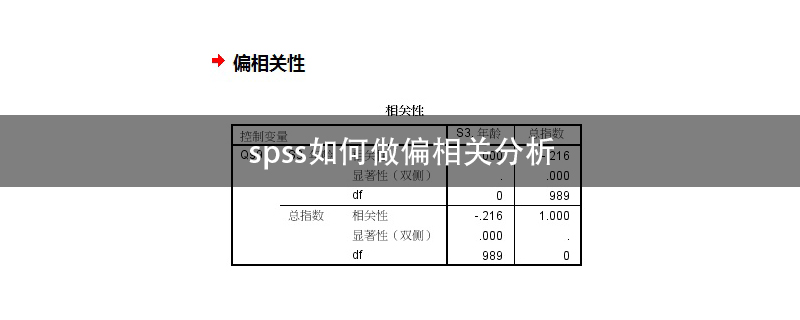
3. Result analysis: There are also two null hypotheses tested by net correlation analysis. The overall partial correlation coefficient is not significantly different from zero." The obtained partial correlation coefficient is 0.335, which is greater than the correlation coefficient of 0.323, indicating that there is a linear relationship. Then observe that the probability value of the partial correlation coefficient is 0, which is less than the significance level of 0.05. Or 0.01, so after excluding the influence of "permanent population", "household income" has a linear relationship with "planned area", but the linear relationship is relatively low.

The above is the detailed content of How to do partial correlation analysis in spss. For more information, please follow other related articles on the PHP Chinese website!

Hot AI Tools

Undresser.AI Undress
AI-powered app for creating realistic nude photos

AI Clothes Remover
Online AI tool for removing clothes from photos.

Undress AI Tool
Undress images for free

Clothoff.io
AI clothes remover

AI Hentai Generator
Generate AI Hentai for free.

Hot Article

Hot Tools

Notepad++7.3.1
Easy-to-use and free code editor

SublimeText3 Chinese version
Chinese version, very easy to use

Zend Studio 13.0.1
Powerful PHP integrated development environment

Dreamweaver CS6
Visual web development tools

SublimeText3 Mac version
God-level code editing software (SublimeText3)

Hot Topics
 How to implement data statistics and analysis in uniapp
Oct 24, 2023 pm 12:37 PM
How to implement data statistics and analysis in uniapp 1. Background introduction Data statistics and analysis are a very important part of the mobile application development process. Through statistics and analysis of user behavior, developers can have an in-depth understanding of user preferences and usage habits. Thereby optimizing product design and user experience. This article will introduce how to implement data statistics and analysis functions in uniapp, and provide some specific code examples. 2. Choose appropriate data statistics and analysis tools. The first step to implement data statistics and analysis in uniapp is to choose the appropriate data statistics and analysis tools.
 How to use MySQL database for forecasting and predictive analytics?
Jul 12, 2023 pm 08:43 PM
How to use MySQL database for forecasting and predictive analytics? Overview: Forecasting and predictive analytics play an important role in data analysis. MySQL, a widely used relational database management system, can also be used for prediction and predictive analysis tasks. This article will introduce how to use MySQL for prediction and predictive analysis, and provide relevant code examples. Data preparation: First, we need to prepare relevant data. Suppose we want to do sales forecasting, we need a table with sales data. In MySQL we can use
 Real-time log monitoring and analysis under Linux
Jul 29, 2023 am 08:06 AM
Real-time log monitoring and analysis under Linux In daily system management and troubleshooting, logs are a very important data source. Through real-time monitoring and analysis of system logs, we can detect abnormal situations in time and handle them accordingly. This article will introduce how to perform real-time log monitoring and analysis under Linux, and provide corresponding code examples. 1. Real-time log monitoring Under Linux, the most commonly used log system is rsyslog. By configuring rsyslog, we can combine the logs of different applications
 Steps of statistical analysis
Jun 28, 2023 pm 03:27 PM
Statistical analysis often refers to the process of sorting, classifying and interpreting collected relevant data. The basic steps of statistical analysis include: 1. Collect data; 2. Organize data; 3. Analyze data.
 How to install spss-spss installation tutorial
Mar 04, 2024 pm 01:30 PM
Many friends still don’t know how to install spss, so the editor will explain the installation tutorial of spss below. If you are in need, please take a look. I believe it will be helpful to everyone. Step 1: First download the SPSS software package from this site, unzip it, run the "exe. file", double-click to open it, enter the installation wizard, and click Next (as shown in the figure). Step 2: Select the installation option and click Next (as shown in the picture). Step 3: Read the agreement before continuing with the installation, click I accept, and click Next (as shown in the picture). Step 4: Select the installation location, the default is C drive, click Next (as shown in the picture). Step 5: Prepare to install, click Install (as shown in the picture). Step 6: The SPSS computer version is being installed, please wait patiently.
 Analysis of the reasons why the secondary directory of DreamWeaver CMS cannot be opened
Mar 13, 2024 pm 06:24 PM
Title: Analysis of the reasons and solutions for why the secondary directory of DreamWeaver CMS cannot be opened. Dreamweaver CMS (DedeCMS) is a powerful open source content management system that is widely used in the construction of various websites. However, sometimes during the process of building a website, you may encounter a situation where the secondary directory cannot be opened, which brings trouble to the normal operation of the website. In this article, we will analyze the possible reasons why the secondary directory cannot be opened and provide specific code examples to solve this problem. 1. Possible cause analysis: Pseudo-static rule configuration problem: during use
 ThinkPHP6 code performance analysis: locating performance bottlenecks
Aug 27, 2023 pm 01:36 PM
ThinkPHP6 code performance analysis: locating performance bottlenecks Introduction: With the rapid development of the Internet, more efficient code performance analysis has become increasingly important for developers. This article will introduce how to use ThinkPHP6 to perform code performance analysis in order to locate and solve performance bottlenecks. At the same time, we will also use code examples to help readers understand better. Importance of Performance Analysis Code performance analysis is an integral part of the development process. By analyzing the performance of the code, we can understand where a lot of resources are consumed
 Case analysis of Python application in intelligent transportation systems
Sep 08, 2023 am 08:13 AM
Summary of case analysis of Python application in intelligent transportation systems: With the rapid development of intelligent transportation systems, Python, as a multifunctional, easy-to-learn and use programming language, is widely used in the development and application of intelligent transportation systems. This article demonstrates the advantages and application potential of Python in the field of intelligent transportation by analyzing application cases of Python in intelligent transportation systems and giving relevant code examples. Introduction Intelligent transportation system refers to the use of modern communication, information, sensing and other technical means to communicate through


