Why does jvm need performance tuning?

JVM tuning goals: Use a smaller memory footprint to obtain higher throughput or lower latency.
Sometimes there will be some JVM problems, large and small, during testing or running of the program before going online, such as excessive CPU load, request delay, reduced tps, etc., and even memory leaks (used for each garbage collection) The time is getting longer and longer, the frequency of garbage collection is getting higher and higher, and the garbage data cleaned up by each garbage collection is getting smaller and smaller), memory overflow causes the system to crash, so the JVM needs to be tuned so that the program can run normally. to achieve higher user experience and operating efficiency.
Here are several important indicators:
Memory usage: The amount of memory required for the normal operation of the program.
Delay: Program pause time due to garbage collection.
Throughput: The ratio of the user program running time to the total time occupied by the user program and garbage collection.
Of course, just like the CAP principle, it is impossible to simultaneously satisfy a program’s small memory footprint, low latency, and high throughput. The goals of the program are different, and the direction to be considered when tuning is It is also different. Before tuning, you must combine the actual scenario, have clear optimization goals, find the performance bottleneck, optimize the bottleneck in a targeted manner, and finally conduct testing to confirm whether the tuning results meet the requirements through various monitoring tools. Target.
JVM Tuning Tool
(1) The data that tuning can rely on and refer to include system running logs, stack error messages, gc logs, thread snapshots, and heap transfers Store snapshots, etc.
① System operation log: The system operation log is the log printed in the program code, which describes the system operation track at the code level (execution method, input parameters, return value, etc.). Generally, there is a problem with the system. The system operation log is the first log to check.
② Stack error information: When an exception occurs in the system, the problem can be initially located based on the stack information. For example, based on "java.lang.OutOfMemoryError: Java heap space", it can be determined that it is a heap memory overflow; based on "java. "lang.StackOverflowError" can be judged to be a stack overflow; "java.lang.OutOfMemoryError: PermGen space" can be judged to be a method area overflow, etc.
③GC log: Use -XX: PrintGCDetails and -Xloggc:/data/jvm/gc.log when the program starts to record the detailed process of gc when the program is running, or directly configure "-verbose:gc "Parameter prints the gc log to the console. Through the recorded gc log, the frequency, time, etc. of gc in each memory area can be analyzed to find problems and perform targeted optimization.
For example, the following GC log:
1 2 3 4 |
|
There are 4 GC logs in total. Looking at the first line of log, "2018-08-02T14:39:11.560-0800" is accurate. UTC universal standard time format at the millisecond level. Configuring the parameter "-XX: PrintGCDateStamps" can print out this timestamp following the gc log. "10.171" is the number of seconds that elapsed from the start of the JVM to the occurrence of gc. The "[GC" at the beginning of the first line of log text indicates that Stop-The-World did not occur in this GC (the user thread paused), and the "[Full GC" at the beginning of the second line of log text indicates that Stop-The-World occurred in this GC. World, so [GC and [Full GC] have nothing to do with the new generation and the old generation, but are related to the type of garbage collector. If you call System.gc() directly, [Full GC(System) will be displayed. The next "[PSYoungGen" and "[ParOldGen" represent the area where GC occurs. The specific name displayed is also related to the garbage collector. For example, "[PSYoungGen" here represents the Parallel Scavenge collector, and "[ParOldGen" represents the Serial Old collection. collector, in addition, the Serial collector displays "[DefNew", the ParNew collector displays "[ParNew", etc. The following "30128K->4091K (30208K)" indicates that after this gc, the memory usage space in this area has been reduced from 30128K to 4091K, and the total memory size is 30208K. "51092K->50790K(98816K), 0.0140970 secs" after the gc description of each area. After this garbage collection, the memory usage space of the entire heap memory was reduced from 51092K to 50790K, and the total space of the entire heap memory was 98816K. gc took 0.0140970 seconds.
④Thread snapshot: As the name implies, you can see the status of the thread at a certain moment according to the thread snapshot. When there may be request timeout, infinite loop, deadlock, etc. in the system, you can further determine based on the thread snapshot. question. By executing the "jstack pid" command that comes with the virtual machine, you can dump the snapshot information of the threads in the current process. There are many examples on the Internet for more detailed use and analysis. This article is already very long, so I won't go into details. , post a blog for reference: http://www.cnblogs.com/kongzhongqijing/articles/3630264.html
⑤ Heap dump snapshot: You can use "-XX: HeapDumpOnOutOfMemory" and " -XX:HeapDumpPath=/data/jvm/dumpfile.hprof", when a memory overflow occurs in the program, the memory snapshot at that time is dumped in the form of a file (you can also directly use the jmap command to dump the memory snapshot at any time when the program is running) ), and analyze the memory usage at that time afterwards.
(2)JVM tuning tool
①用 jps(JVM process Status)可以查看虚拟机启动的所有进程、执行主类的全名、JVM启动参数,比如当执行了JPSTest类中的main方法后(main方法持续执行),执行 jps -l可看到下面的JPSTest类的pid为31354,加上-v参数还可以看到JVM启动参数。
1 2 3 4 5 |
|
②用jstat(JVM Statistics Monitoring Tool)监视虚拟机信息
jstat -gc pid 500 10 :每500毫秒打印一次Java堆状况(各个区的容量、使用容量、gc时间等信息),打印10次
1 2 3 4 5 6 7 8 9 10 11 |
|
jstat还可以以其他角度监视各区内存大小、监视类装载信息等,具体可以google jstat的详细用法。
③用jmap(Memory Map for Java)查看堆内存信息
执行jmap -histo pid可以打印出当前堆中所有每个类的实例数量和内存占用,如下,class name是每个类的类名([B是byte类型,[C是char类型,[I是int类型),bytes是这个类的所有示例占用内存大小,instances是这个类的实例数量:
1 2 3 4 5 6 7 8 9 10 11 12 13 |
|
执行 jmap -dump 可以转储堆内存快照到指定文件,比如执行 jmap -dump:format=b,file=/data/jvm/dumpfile_jmap.hprof 3361 可以把当前堆内存的快照转储到dumpfile_jmap.hprof文件中,然后可以对内存快照进行分析。
④利用jconsole、jvisualvm分析内存信息(各个区如Eden、Survivor、Old等内存变化情况),如果查看的是远程服务器的JVM,程序启动需要加上如下参数:
1 2 3 4 5 |
|
下图是jconsole界面,概览选项可以观测堆内存使用量、线程数、类加载数和CPU占用率;内存选项可以查看堆中各个区域的内存使用量和左下角的详细描述(内存大小、GC情况等);线程选项可以查看当前JVM加载的线程,查看每个线程的堆栈信息,还可以检测死锁;VM概要描述了虚拟机的各种详细参数。(jconsole功能演示)
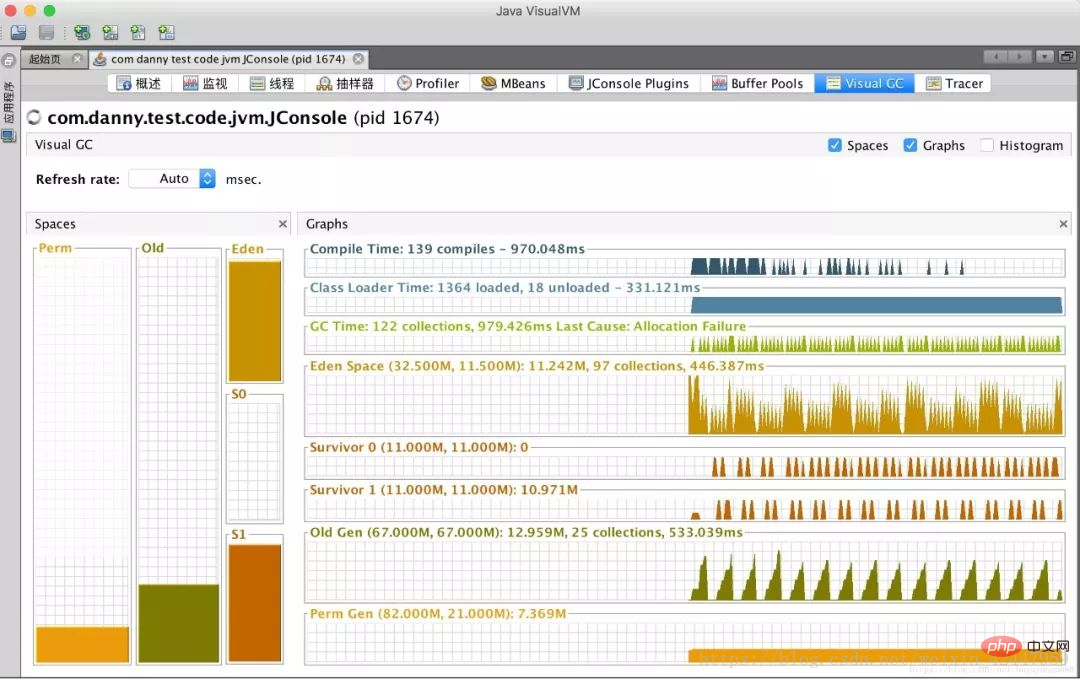
下图是jvisualvm的界面,功能比jconsole略丰富一些,不过大部分功能都需要安装插件。概述跟jconsole的VM概要差不多,描述的是jvm的详细参数和程序启动参数;监视展示的和jconsole的概览界面差不多(CPU、堆/方法区、类加载、线程);线程和jconsole的线程界面差不多;抽样器可以展示当前占用内存的类的排行榜及其实例的个数;Visual GC可以更丰富地展示当前各个区域的内存占用大小及历史信息(下图)。(jvisualvm功能演示)

⑤分析堆转储快照
前面说到配置了 “-XX:+HeapDumpOnOutOfMemory” 参数可以在程序发生内存溢出时dump出当前的内存快照,也可以用jmap命令随时dump出当时内存状态的快照信息,dump的内存快照一般是以.hprof为后缀的二进制格式文件。
可以直接用 jhat(JVM Heap Analysis Tool) 命令来分析内存快照,它的本质实际上内嵌了一个微型的服务器,可以通过浏览器来分析对应的内存快照,比如执行 jhat -port 9810 -J-Xmx4G /data/jvm/dumpfile_jmap.hprof 表示以9810端口启动 jhat 内嵌的服务器:
1 2 3 4 5 6 7 8 9 |
|
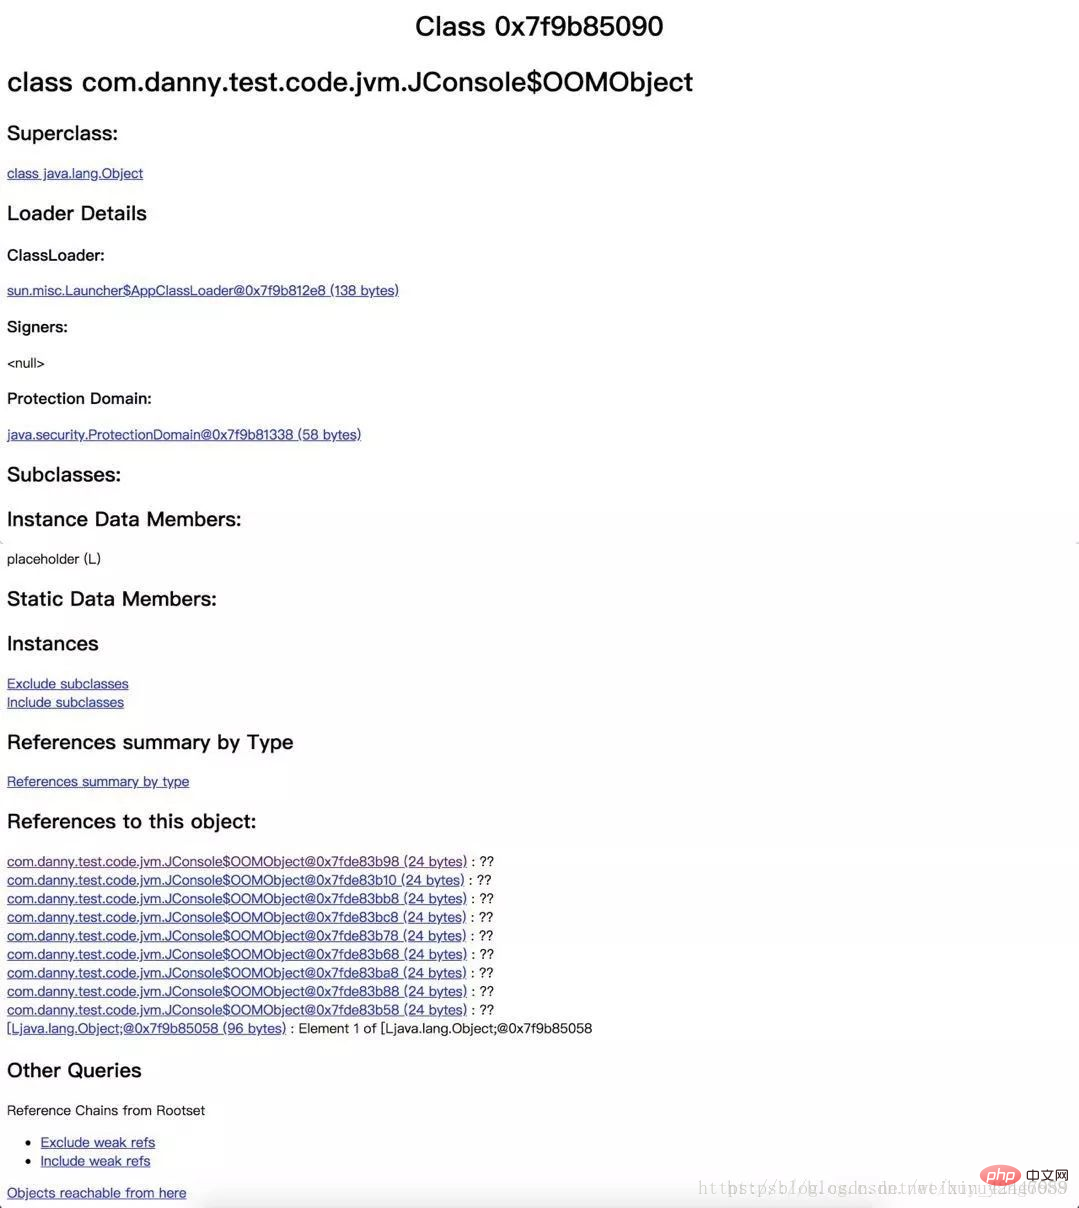
在控制台可以看到服务器启动了,访问 http://127.0.0.1:9810/ 可以看到对快照中的每个类进行分析的结果(界面略low),下图是我随便选择了一个类的信息,有这个类的父类,加载这个类的类加载器和占用的空间大小,下面还有这个类的每个实例(References)及其内存地址和大小,点进去会显示这个实例的一些成员变量等信息:
jvisualvm也可以分析内存快照,在jvisualvm菜单的“文件”-“装入”,选择堆内存快照,快照中的信息就以图形界面展示出来了,如下,主要可以查看每个类占用的空间、实例的数量和实例的详情等:
还有很多分析内存快照的第三方工具,比如eclipse mat,它比jvisualvm功能更专业,出了查看每个类及对应实例占用的空间、数量,还可以查询对象之间的调用链,可以查看某个实例到GC Root之间的链,等等。可以在eclipse中安装mat插件,也可以下载独立的版本(http://www.eclipse.org/mat/downloads.php ),我在mac上安装后运行起来老卡死~下面是在windows上的截图(MAT功能演示):
(3) JVM tuning experience
In terms of JVM configuration, in general, you can use the default configuration first (some basic initial parameters can ensure that general applications run more stably). During the test, according to the system Operating status (session concurrency, session time, etc.), combined with gc logs, memory monitoring, garbage collectors used, etc., make reasonable adjustments. When the old generation memory is too small, it may cause frequent Full GC. When the memory is too large, the Full GC time It will be extremely long.
So what is the most appropriate JVM configuration, such as the new generation and old generation? The answer is not necessarily. Tuning is the process of finding the answer. When the physical memory is certain, the larger the new generation setting, the smaller the old generation, the higher the Full GC frequency, but the shorter the Full GC time; on the contrary, the new generation setting The smaller it is, the larger the old generation is and the lower the frequency of Full GC, but the more time each Full GC consumes. The suggestions are as follows:
The values of -Xms and -Xmx are set to be equal. The heap size defaults to the size specified by -Xms. When the default free heap memory is less than 40%, the JVM will expand the heap to The size specified by -Xmx; when the free heap memory is greater than 70%, the JVM will reduce the heap to the size specified by -Xms. If the memory demand cannot be met after Full GC, it will be dynamically adjusted. This stage is relatively resource-consuming.
The new generation should be set as large as possible to allow objects to survive in the new generation for a longer period of time. Each Minor GC must collect as many garbage objects as possible to prevent or delay objects from entering the old generation. opportunity to reduce the frequency of Full GC occurring in your application.
If you use the CMS collector in the old generation, the new generation does not need to be too large, because the parallel collection speed of CMS is also very fast, and the concurrent marking and concurrent clearing phases of the collection process are time-consuming. Can be executed concurrently with user threads.
Setting the size of the method area. Before 1.6, you need to consider the constants, static variables, etc. that are dynamically added when the system is running. In 1.7, as long as it can almost accommodate the class information that is dynamically loaded at startup and later. That’s it.
In terms of code implementation, performance problems such as program waiting and memory leaks may not only have problems with JVM configuration, but also have a lot to do with code implementation:
Avoid creating overly large objects and arrays: Overly large objects or arrays will directly enter the old generation when the new generation does not have enough space to accommodate them. If they are short-lived large objects, Full GC will start in advance.
Avoid loading a large amount of data at the same time, such as fetching a large amount of data from the database at one time, or reading a large number of records from Excel at one time. You can read in batches and clear the references as soon as possible.
When there are references to objects in the collection, the references in the collection must be cleared as soon as possible after these objects are used. These useless objects must be recycled as soon as possible to avoid entering the old age.
Soft references and weak references can be used in appropriate scenarios (such as implementing caching). For example, soft references are used to allocate instances of ObjectA: SoftReference objectA=new SoftReference(); when memory is generated Before overflow, objectA will be included in the recycling range for secondary recycling. If there is not enough memory for this recycling, a memory overflow exception will be thrown.
Avoid an infinite loop. After an infinite loop occurs, a large number of instances may be repeatedly generated in the loop body, causing the memory space to be quickly filled up.Try to avoid waiting for long periods of time for external resources (database, network, equipment resources, etc.), shorten the life cycle of objects, and avoid entering the old age. If the results cannot be returned in time, you can use them appropriately. Asynchronous processing methods, etc.
(4) JVM problem troubleshooting record case
JVM service problem troubleshooting https://blog.csdn.net/jacin1/article/details/44837595
unforgettable troubleshooting of frequent Full GC process http://caogen81.iteye.com/blog/1513345
Frequent troubleshooting of online FullGC https://blog.csdn.net/wilsonpeng3 /article/details/70064336/
[JVM] Online application troubleshooting https://www.cnblogs.com/Dhouse/p/7839810.html
A troubleshooting of FullGC in JVM Process http://iamzhongyong.iteye.com/blog/1830265
Troubleshooting case of excessive CPU caused by JVM memory overflow https://blog.csdn.net/nielinqi520/article/details/78455614
A java memory leak troubleshooting case https://blog.csdn.net/aasgis6u/article/details/54928744
(5) Common JVM parameter reference:
## of the entire heap #-Xmn512M-XssThread stack size, jdk1.5 and later defaults to 1M, before the default is 256k-Xss512k-XX:NewRatio=nSet the ratio between the new generation and the old generation. For example: if it is 3, it means that the ratio between the young generation and the old generation is 1:3, and the young generation accounts for 1/4 of the entire young generation and the old generation. -XX:NewRatio=3-XX:SurvivorRatio=nThe ratio of the Eden area to the two Survivor areas in the young generation. Note that there are two Survivor areas. For example: 8, means Eden: Survivor=8:1:1, one Survivor area accounts for 1/8 of the entire young generation-XX:SurvivorRatio=8 -XX:PermSize=nInitial value of the permanent generation, the default is 1/64 of the physical memory-XX:PermSize=128M- XX:MaxPermSize=nMaximum permanent generation size, default is 1/4 of physical memory-XX:MaxPermSize=256M-verbose :classPrint class loading information on the console-verbose:gcPrint garbage collection log on the console -XX: PrintGCPrint the GC log, the content is simple-XX: PrintGCDetailsPrint GC log with detailed content-XX: PrintGCDateStamps in the GC log Add timestamp -Xloggc:filenameSpecify gc log path-Xloggc:/data/jvm/gc .log-XX: UseSerialGCYoung generation sets the serial collector Serial -XX: UseParallelGCYoung generation sets parallel collector Parallel Scavenge-XX:ParallelGCThreads=nSet Parallel The number of CPUs used during Scavenge collection. Number of parallel collection threads. -XX:ParallelGCThreads=4-XX:MaxGCPauseMillis=nSet the maximum time for Parallel Scavenge recycling (milliseconds)-XX:MaxGCPauseMillis=100-XX:GCTimeRatio=nSet Parallel Scavenge garbage collection time as a percentage of program running time. The formula is 1/(1 n)-XX:GCTimeRatio=19-XX: UseParallelOldGCSet the old generation to be collected by the parallel collector ParallelOld Collector-XX: UseConcMarkSweepGCSet the old generation concurrent collector CMS-XX: CMSIncrementalModeSet the CMS collector to incremental mode, suitable for single CPU situations.| Parameters | Description | Instance |
|---|---|---|
| -Xms | Initial heap size, 1/64 of default physical memory | -Xms512M |
| -Xmx | Maximum heap size, default physical memory 1/4 | -Xms2G |
| -Xmn | New generation memory size, the official recommendation is 3/8 | |
java tutorial column, welcome to learn!
The above is the detailed content of Why does jvm need performance tuning?. For more information, please follow other related articles on the PHP Chinese website!

Hot AI Tools

Undresser.AI Undress
AI-powered app for creating realistic nude photos

AI Clothes Remover
Online AI tool for removing clothes from photos.

Undress AI Tool
Undress images for free

Clothoff.io
AI clothes remover

Video Face Swap
Swap faces in any video effortlessly with our completely free AI face swap tool!

Hot Article

Hot Tools

Notepad++7.3.1
Easy-to-use and free code editor

SublimeText3 Chinese version
Chinese version, very easy to use

Zend Studio 13.0.1
Powerful PHP integrated development environment

Dreamweaver CS6
Visual web development tools

SublimeText3 Mac version
God-level code editing software (SublimeText3)

Hot Topics
 1392
1392
 52
52
 Perfect Number in Java
Aug 30, 2024 pm 04:28 PM
Guide to Perfect Number in Java. Here we discuss the Definition, How to check Perfect number in Java?, examples with code implementation.
 Weka in Java
Aug 30, 2024 pm 04:28 PM
Guide to Weka in Java. Here we discuss the Introduction, how to use weka java, the type of platform, and advantages with examples.
 Smith Number in Java
Aug 30, 2024 pm 04:28 PM
Guide to Smith Number in Java. Here we discuss the Definition, How to check smith number in Java? example with code implementation.
 Java Spring Interview Questions
Aug 30, 2024 pm 04:29 PM
In this article, we have kept the most asked Java Spring Interview Questions with their detailed answers. So that you can crack the interview.
 Break or return from Java 8 stream forEach?
Feb 07, 2025 pm 12:09 PM
Java 8 introduces the Stream API, providing a powerful and expressive way to process data collections. However, a common question when using Stream is: How to break or return from a forEach operation? Traditional loops allow for early interruption or return, but Stream's forEach method does not directly support this method. This article will explain the reasons and explore alternative methods for implementing premature termination in Stream processing systems. Further reading: Java Stream API improvements Understand Stream forEach The forEach method is a terminal operation that performs one operation on each element in the Stream. Its design intention is
 TimeStamp to Date in Java
Aug 30, 2024 pm 04:28 PM
Guide to TimeStamp to Date in Java. Here we also discuss the introduction and how to convert timestamp to date in java along with examples.
 Java Program to Find the Volume of Capsule
Feb 07, 2025 am 11:37 AM
Capsules are three-dimensional geometric figures, composed of a cylinder and a hemisphere at both ends. The volume of the capsule can be calculated by adding the volume of the cylinder and the volume of the hemisphere at both ends. This tutorial will discuss how to calculate the volume of a given capsule in Java using different methods. Capsule volume formula The formula for capsule volume is as follows: Capsule volume = Cylindrical volume Volume Two hemisphere volume in, r: The radius of the hemisphere. h: The height of the cylinder (excluding the hemisphere). Example 1 enter Radius = 5 units Height = 10 units Output Volume = 1570.8 cubic units explain Calculate volume using formula: Volume = π × r2 × h (4
 Create the Future: Java Programming for Absolute Beginners
Oct 13, 2024 pm 01:32 PM
Java is a popular programming language that can be learned by both beginners and experienced developers. This tutorial starts with basic concepts and progresses through advanced topics. After installing the Java Development Kit, you can practice programming by creating a simple "Hello, World!" program. After you understand the code, use the command prompt to compile and run the program, and "Hello, World!" will be output on the console. Learning Java starts your programming journey, and as your mastery deepens, you can create more complex applications.


