When people sit at home, pots come from the sky.
I was writing a project at home half a month ago, but before I had time to test it, the leader suddenly called me and asked me to support another project immediately. When I asked about it, I found out that it was a project that had not been completed for half a year. If you don’t want to in your heart, you still have to go. Because Lu Xun said, life is like rape. Since you can't resist, just enjoy it.
This project is divided into PC side, user side applet and merchant side applet. Here we mainly talk about a certain module in the merchant side, which requires the use of data statistics charts. At that time, I felt that there were two A good plug-in:
echarts a lot in the project before, I finally chose echarts as the chart plug-in in the project
Introduction of echarts
I introduced it according to the official website tutorial ofecharts. It is very simple, not much to say. Portal
Using multiple charts in echarts
wxml code is as follows:<!--图表1--><view class="echarts-container" hidden="{{!isShoweyes || !echartsData.totalRecentRansactions.allTotalMoney}}">
<ec-canvas id="mychart-dom-turnover" canvas-id="mychart-turnover" ec="{{ turnoverEc }}"></ec-canvas></view><!--图表2--><view class="echarts-container" hidden="{{!isShoweyes || !echartsData.shopNewCustomerRespVo.allNewCustomer}}">
<ec-canvas id="mychart-dom-customer" canvas-id="mychart-customer" ec="{{ customerEc }}"></ec-canvas></view><!--图表3--><view class="echarts-container" hidden="{{!isShoweyes || !echartsData.customerOrderAverageRespVo.customerAverage}}">
<ec-canvas id="mychart-dom-price" canvas-id="mychart-price" ec="{{ priceEc }}"></ec-canvas></view><!--通过lazyLoad设置图表懒加载-->data: {
isShoweyes: true,
turnoverEc: {
lazyLoad: true,
},
customerEc: {
lazyLoad: true,
},
priceEc: {
lazyLoad: true,
},
echartsData: {}
},
<!--页面加载时创建对应的canvas面板-->onLoad: function (options) {
this.echartsComponnet1 = this.selectComponent('#mychart-dom-turnover');
this.echartsComponnet2 = this.selectComponent('#mychart-dom-customer');
this.echartsComponnet3 = this.selectComponent('#mychart-dom-price');
},
<!--获取到数据后,初始化报表-->
getData: function () {
// .... 获取数据
<!--此用循环初始化几个图表-->
for (let i = 1; i < 4; i++) {
if (!Chart[i]) {
this.initEcharts(i); //初始化图表
} else {
this.setOption(i); //更新数据
}
}
},
<!--//初始化图表-->
initEcharts: function (i) {
this['echartsComponnet' + i].init((canvas, width, height) => {
// 初始化图表
Chart[i - 1] = echarts.init(canvas, null, {
width: width,
height: height
});
this.setOption(i);
// 注意这里一定要返回 chart 实例,否则会影响事件处理等
return Chart[i - 1];
});
},
setOption: function (i) {
Chart[i - 1].clear(); // 清除
Chart[i - 1].setOption(this['getOption' + i]()); //获取新数据
},
<!--设置报表需要的配置项-->
getOption1() {
let {
echartsData
} = this.data;
return {
color: ['#0179FF'],
tooltip: {
trigger: 'axis',
axisPointer: { // 坐标轴指示器,坐标轴触发有效
type: 'shadow', // 默认为直线,可选为:'line' | 'shadow'
shadowStyle: {
opacity: 0.8
}
},
formatter: this.formatterTooltip,
position: this.setTooltipPositionfunction
},
grid: {
left: 20,
right: 20,
bottom: 15,
top: 40,
containLabel: true
},
xAxis: [{
type: 'category',
axisLine: {
lineStyle: {
color: '#999',
}
},
axisLabel: {
color: '#666',
},
data: echartsData.totalRecentRansactions.dates,
}
],
yAxis: [{
type: 'value',
axisTick: {
show: false
},
axisLine: {
show: false,
lineStyle: {
color: '#999',
}
},
axisLabel: {
color: '#666',
fontSize: 13
}
}],
series: [{
name: '订单总额',
type: 'line',
label: {
normal: {
show: true,// 是否在折线点上显示数值
position: 'inside'
}
},
data: echartsData.totalRecentRansactions.allTotalMoney
}]
};
}
遇到的坑
1.Tooltip支持不好
虽然官网上echarts暂时不支持Tooltip,但是经过试验,还是Tooltip还是有效果的,但是,x轴对应的坐标值并不会显示在Tooltip中,需要使用Tooltip的formatter函数,自己处理需要展示的数据,代码如下:
// 格式化Tooltip
formatterTooltip(param) { return "日期:" + param[0].name + "\n" + param[0].seriesName + ": " + param[0].data
},
2.当点击靠近屏幕右侧或者底部的item项时,Tooltip会溢出边界,解决办法:
给Tooltip的position函数返回一个根据点击位置计算的坐标点,(也可以给一个固定的位置,但是体验不好)
// 更改Tooltip的位置,处理边界超出的情况
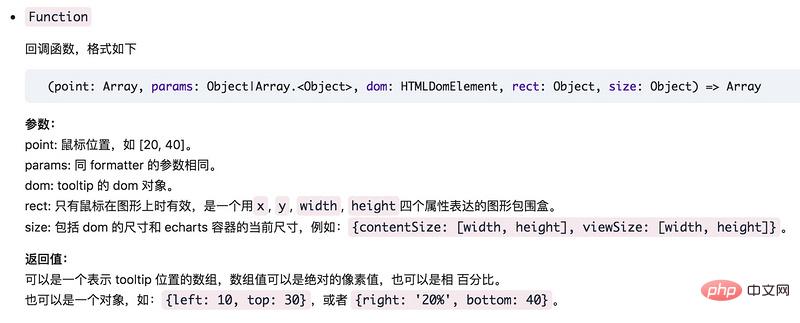
setTooltipPositionfunction(point, params, dom, rect, size) { //其中point为当前鼠标的位置,size中有两个属性:viewSize和contentSize,分别为外层div和tooltip提示框的大小
// 更改提示框的显示位置
let x = point[0];//
let y = point[1]; // size: 包括 dom 的尺寸和 echarts 容器的当前尺寸,例如:{contentSize: [width, height], viewSize: [width, height]}
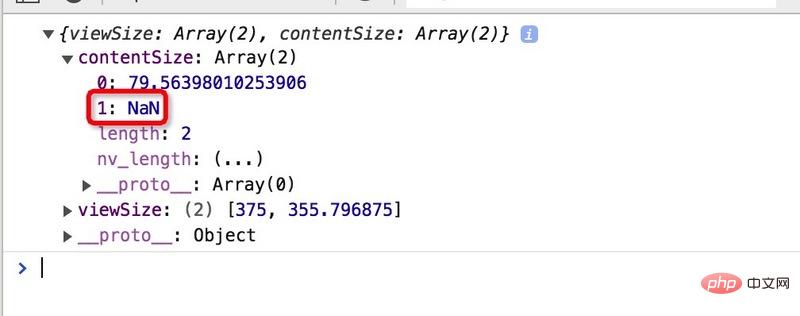
let boxWidth = size.contentSize[0]; // let boxHeight = size.contentSize[1]; // size里面此处获取不到dom的高度,值为NAN,所以下面指定了一个固定值
let boxHeight = 50; let posX = 0;//x坐标位置
let posY = 0;//y坐标位置
if (x < boxWidth) {//左边放不开
posX = 5;
} else {//左边放的下
posX = x - boxWidth;
} if (y < boxHeight) {//上边放不开
posY = 5;
} else {//上边放得下
posY = y - boxHeight;
} return [posX, posY];
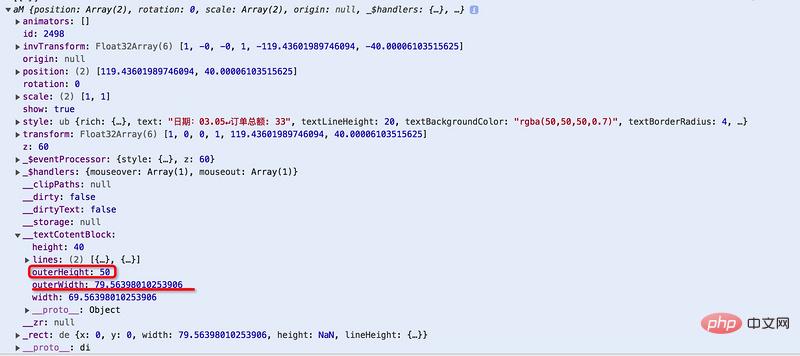
},dom, officially it can be obtained from the size parameter of the position callback function## The height of #dom, but when I print it out it is NAN.
 Print the result:
 Later it was found that the parameter
is in outerWidth# The value of ## is the same as the width value of contentSize in parameter size, so decisively take outerHeight in parameter params as The height of dom, the final running effect is indeed no problem.
3. When sliding the histogram left or right, the histogram drawing board will become blank. Click on the blank and the histogram will appear again, and this problem only occurs on the histogram! 
<canvas class="ec-canvas" canvas-id="{{ canvasId }}" bindinit="init" bindtouchstart="{{ ec.disableTouch ? '' : 'touchStart' }}" bindtouchmove="{{ ec.disableTouch ? '' : 'touchMove' }}" bindtouchend="{{ ec.disableTouch ? '' : 'touchEnd' }}"></canvas>bindtouchmove
event to the canvastouchMove(e) { if (this.chart && e.touches.length > 0) { var touch = e.touches[0]; var handler = this.chart.getZr().handler;
handler.dispatch('mousemove', {
zrX: touch.x,
zrY: touch.y
});
handler.processGesture(wrapTouch(e), 'change');
}
},Here goes again After calling the method in echarts.js, I finally thought of a crude solution: Delete the bindtouchmove event in the source code
Perfect solution, haha or prosperous and trance~~~
<img src="/static/imghw/default1.png" data-src="https://img.php.cn/upload/image/417/204/228/1591249707644801.jpg" class="lazy" title="1591249707644801.jpg" alt="Using echarts in WeChat mini program">##The above is what I have done in the mini program I encountered some pitfalls when using echarts. I hope it can help those who encounter pitfalls later.
Final effect picture

Demo source code

Recommended tutorial: "JS Tutorial"
The above is the detailed content of Using echarts in WeChat mini program. For more information, please follow other related articles on the PHP Chinese website!


