Introducing MySQL's real-time performance monitoring tool

Real-time performance status data of the operating system and mysql database are particularly important, especially when there is performance jitter. These real-time performance data can quickly help you locate the performance of the system or MySQL database. Bottlenecks, just like when you use command tools such as "top, sar, iostat" on a Linux system, you can immediately determine whether the performance bottleneck of the OS is on IO or CPU, so it is more important to collect/display these performance data. What important real-time performance status indicators can reflect the performance load of the system and MySQL database?
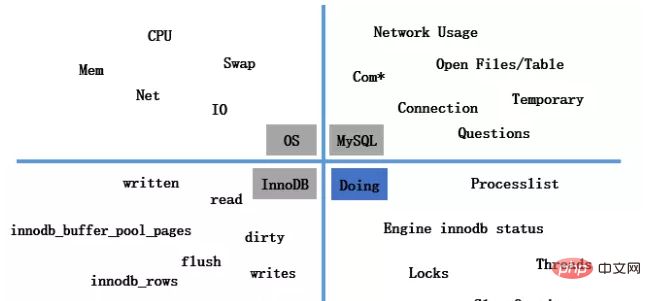
Currently, running MySQL on Linux is standard for most Internet companies. The performance data indicators in the above picture are the real-time indicators that I think are more important in Linux, MySQL, and InnoDB. Status data, however, the Doing column in the above picture is actually more important. The reason why it is called Doing is because indicator items such as "processlist, engine innodb status, locks" truly reflect what MySQL is doing at this time.
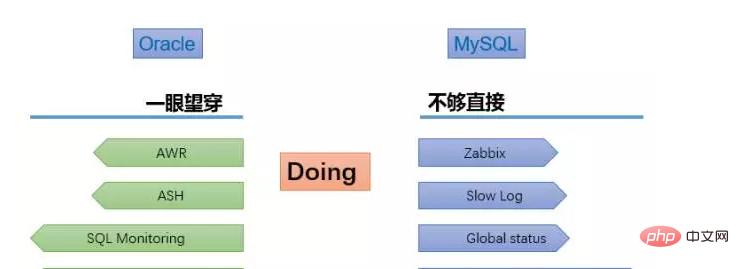
Let’s take a look at the Oracle database. The Oracle database provides many diagnostic tools such as "AWR, ASH, SQL Monitor", etc. You can see at a glance what the database is doing. What, you can even know the performance load and what the database was doing at any time period in the past 30 days.
Although there are excellent monitoring tools such as "zabbix, PMM" in MySQL, they can only reflect some performance data curves of the database history. For example, TPS is high, temporary tables are used too much, and InnoDB Deadlocks, but for what MySQL was doing at the time, I can only say that it was not direct enough. If you are on site, you can catch what MySQL is doing, but there are always times when you are not on site. If you were asked what was the reason for the performance jitter of the database last night? How to quickly reproduce the scene to find the cause of the jitter?
The answer is to use "doDBA tools", which is a free console-based monitoring tool.
What are doDBA tools
doDBA tools is a console-based remote monitoring tool. It does not require any software to be installed on the local/remote system. It can collect real-time data on the operating system, MySQL, InnoDB provides real-time performance status data and can generate Doing log files to help you quickly understand/optimize the system and MySQL database.
Features
基于golang语言开发
可收集Linux、MySQL相关性能数据
可本地或远程收集,可多台
mytop --Like Linux TOP
基于并发生成Doing日志,复现现场
可记录到日志文件
doDBA tools 工作原理
Remotely collect system information by connecting to the remote server through ssh (user name and password or establishing trust). The collection method is by reading the Linux proc file meminfo, diskstats, uptime, net, vmstat, cpuinfo, loadavg and other files, which are consistent with pmm and zabbix collection methods.
Remotely collect MySQL information by connecting to the MySQL database through MySQL tcp. You only need to grant the connection user PROCESS and SELECT permissions.
The collection of system information and MySQL information can be separated. If you only want to collect system information, you only need to provide the system user name and password. If you only collect MySQL, you can only provide MySQL connection information. If you are an rds user, you can Using the -rds parameter, the collection of system information will be automatically ignored when using mytop.
How to use
Github主页:
https://github.com/dblucyne/dodba_tools
Download:
wget https://raw.githubusercontent.com/dblucyne/dodba_tools/master/doDBA --no-check-certificatewget https://raw.githubusercontent.com/dblucyne/dodba_tools/master/doDBA.conf --no-check-certificatechmod +x doDBA
You can use it directly after downloading it, and it does not depend on any environment.
Usage help:
./doDBA -help
  -c string
    configuration file.(default "doDBA.conf")
  -h string
    Connect to host/IP.
  -sys
    Print linux info.
  -myall
    Print linux and mysql info.
  -mysql
    Print mysql info.
  -innodb
    Print innodb info.
  -mytop
    Print mysql prcesslist,like top.
  -i duration
    refresh interval in seconds.(1s)
  -t int
    doing on Threads_running.(50)
 -rds
   Ignore system info.
  -log
    Print to file by day.
  -nocolor
Print to nocolor.Usage examples
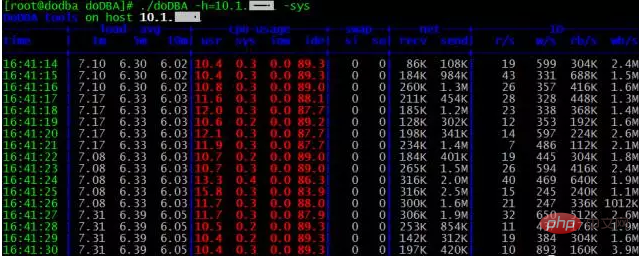
1. Collect Linux performance data
./doDBA -h=10.1.x.xx -sys
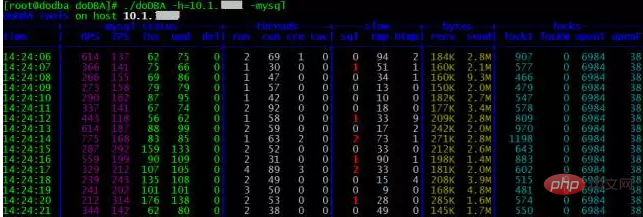
2 . Collect MySQL performance data
./doDBA -h=10.1.x.xx -mysql
3. Collect InnoDB performance data
./doDBA -h=10.1.x.xx -innodb
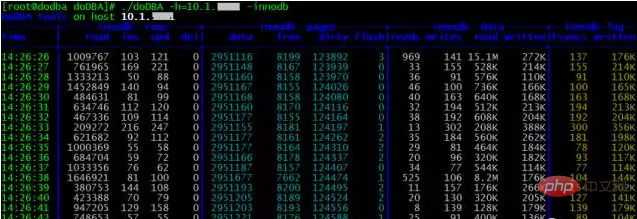
./doDBA -h=10.1.x.xx -myall

./doDBA -h=10.1.x.xx -mytop

6. 借助Shell收集多台
cat ip.txt
10.1.x.x110.1.x.x2
Shell
cat ip.txt | while read ip;  do  echo $ip; ./doDBA -h=$ip -mysql -log </dev/null &  done
7. 收集到日志文件
./doDBA -h=10.1.x.xx -mysql -log

8. 开启Doing功能
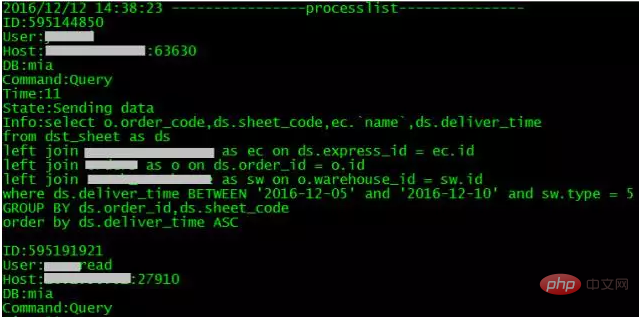
使用【-t】参数可以基于Threads_running的数量设置阈值,设置后可记录「processlist,engine innodb status」信息到dodba.log日志中,--复现现场。
/doDBA -h=10.1.x.xx -myall -t=3

9. 查看Doing日志
tail -f dodba.log
以上就是MySQL 的实时性能监控利器的全部内容。
相关参考:MySQL教程
The above is the detailed content of Introducing MySQL's real-time performance monitoring tool. For more information, please follow other related articles on the PHP Chinese website!

Hot AI Tools

Undresser.AI Undress
AI-powered app for creating realistic nude photos

AI Clothes Remover
Online AI tool for removing clothes from photos.

Undress AI Tool
Undress images for free

Clothoff.io
AI clothes remover

Video Face Swap
Swap faces in any video effortlessly with our completely free AI face swap tool!

Hot Article

Hot Tools

Notepad++7.3.1
Easy-to-use and free code editor

SublimeText3 Chinese version
Chinese version, very easy to use

Zend Studio 13.0.1
Powerful PHP integrated development environment

Dreamweaver CS6
Visual web development tools

SublimeText3 Mac version
God-level code editing software (SublimeText3)

Hot Topics
 1386
1386
 52
52
 MySQL: Simple Concepts for Easy Learning
Apr 10, 2025 am 09:29 AM
MySQL is an open source relational database management system. 1) Create database and tables: Use the CREATEDATABASE and CREATETABLE commands. 2) Basic operations: INSERT, UPDATE, DELETE and SELECT. 3) Advanced operations: JOIN, subquery and transaction processing. 4) Debugging skills: Check syntax, data type and permissions. 5) Optimization suggestions: Use indexes, avoid SELECT* and use transactions.
 How to open phpmyadmin
Apr 10, 2025 pm 10:51 PM
You can open phpMyAdmin through the following steps: 1. Log in to the website control panel; 2. Find and click the phpMyAdmin icon; 3. Enter MySQL credentials; 4. Click "Login".
 MySQL: An Introduction to the World's Most Popular Database
Apr 12, 2025 am 12:18 AM
MySQL is an open source relational database management system, mainly used to store and retrieve data quickly and reliably. Its working principle includes client requests, query resolution, execution of queries and return results. Examples of usage include creating tables, inserting and querying data, and advanced features such as JOIN operations. Common errors involve SQL syntax, data types, and permissions, and optimization suggestions include the use of indexes, optimized queries, and partitioning of tables.
 How to use single threaded redis
Apr 10, 2025 pm 07:12 PM
Redis uses a single threaded architecture to provide high performance, simplicity, and consistency. It utilizes I/O multiplexing, event loops, non-blocking I/O, and shared memory to improve concurrency, but with limitations of concurrency limitations, single point of failure, and unsuitable for write-intensive workloads.
 Why Use MySQL? Benefits and Advantages
Apr 12, 2025 am 12:17 AM
MySQL is chosen for its performance, reliability, ease of use, and community support. 1.MySQL provides efficient data storage and retrieval functions, supporting multiple data types and advanced query operations. 2. Adopt client-server architecture and multiple storage engines to support transaction and query optimization. 3. Easy to use, supports a variety of operating systems and programming languages. 4. Have strong community support and provide rich resources and solutions.
 MySQL's Place: Databases and Programming
Apr 13, 2025 am 12:18 AM
MySQL's position in databases and programming is very important. It is an open source relational database management system that is widely used in various application scenarios. 1) MySQL provides efficient data storage, organization and retrieval functions, supporting Web, mobile and enterprise-level systems. 2) It uses a client-server architecture, supports multiple storage engines and index optimization. 3) Basic usages include creating tables and inserting data, and advanced usages involve multi-table JOINs and complex queries. 4) Frequently asked questions such as SQL syntax errors and performance issues can be debugged through the EXPLAIN command and slow query log. 5) Performance optimization methods include rational use of indexes, optimized query and use of caches. Best practices include using transactions and PreparedStatemen
 MySQL and SQL: Essential Skills for Developers
Apr 10, 2025 am 09:30 AM
MySQL and SQL are essential skills for developers. 1.MySQL is an open source relational database management system, and SQL is the standard language used to manage and operate databases. 2.MySQL supports multiple storage engines through efficient data storage and retrieval functions, and SQL completes complex data operations through simple statements. 3. Examples of usage include basic queries and advanced queries, such as filtering and sorting by condition. 4. Common errors include syntax errors and performance issues, which can be optimized by checking SQL statements and using EXPLAIN commands. 5. Performance optimization techniques include using indexes, avoiding full table scanning, optimizing JOIN operations and improving code readability.
 Monitor Redis Droplet with Redis Exporter Service
Apr 10, 2025 pm 01:36 PM
Effective monitoring of Redis databases is critical to maintaining optimal performance, identifying potential bottlenecks, and ensuring overall system reliability. Redis Exporter Service is a powerful utility designed to monitor Redis databases using Prometheus. This tutorial will guide you through the complete setup and configuration of Redis Exporter Service, ensuring you seamlessly build monitoring solutions. By studying this tutorial, you will achieve fully operational monitoring settings


