

How to fit a function in excel?
Method: 1. Open the table document; 2. Select the data to be fitted; 3. In the menu bar, click "Insert" - "Recommended Charts" and select the appropriate chart; 4. Move the mouse Go to the generated graph, right-click, and select "Add Trend Line"; 5. In the "Set Trend Line Format" column, check Show formula, and the fitted function equation will be displayed in the graph.

The operating environment of this tutorial: windows10 system, Microsoft Office Excel2016 version, Dell G3 computer
excel fitting function Operation method:
1. Open the table document.

#2. Select the data to be fitted
Hold down the left mouse button and select the data to be analyzed and fitted.

#3. Click the Insert button in the menu bar above, and then click the recommended chart.

#4. Select the appropriate data representation form in the pop-up window and click OK.

5. Move the mouse cursor to the generated graph line, then right-click the mouse and click "Add Trend Line" in the drop-down menu.

6. The "Format Trend Line" column will appear on the right. Pull the scroll bar to the bottom and check "Show Formula" and "Show R-squared Value" , the fitted function equation and R-squared value will be displayed in the figure.

Recommended tutorial: "excel tutorial"
The above is the detailed content of How to fit a function in excel?. For more information, please follow other related articles on the PHP Chinese website!

Hot AI Tools

Undresser.AI Undress
AI-powered app for creating realistic nude photos

AI Clothes Remover
Online AI tool for removing clothes from photos.

Undress AI Tool
Undress images for free

Clothoff.io
AI clothes remover

AI Hentai Generator
Generate AI Hentai for free.

Hot Article
Hot Tools

Notepad++7.3.1
Easy-to-use and free code editor

SublimeText3 Chinese version
Chinese version, very easy to use

Zend Studio 13.0.1
Powerful PHP integrated development environment

Dreamweaver CS6
Visual web development tools

SublimeText3 Mac version
God-level code editing software (SublimeText3)
Hot Topics


 how to do a drop down in excel
Mar 12, 2025 am 11:53 AM
how to do a drop down in excel
Mar 12, 2025 am 11:53 AM
This article explains how to create drop-down lists in Excel using data validation, including single and dependent lists. It details the process, offers solutions for common scenarios, and discusses limitations such as data entry restrictions and pe
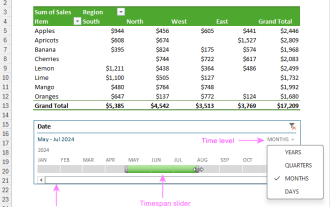 How to create timeline in Excel to filter pivot tables and charts
Mar 22, 2025 am 11:20 AM
How to create timeline in Excel to filter pivot tables and charts
Mar 22, 2025 am 11:20 AM
This article will guide you through the process of creating a timeline for Excel pivot tables and charts and demonstrate how you can use it to interact with your data in a dynamic and engaging way. You've got your data organized in a pivo
 how to sum a column in excel
Mar 14, 2025 pm 02:42 PM
how to sum a column in excel
Mar 14, 2025 pm 02:42 PM
The article discusses methods to sum columns in Excel using the SUM function, AutoSum feature, and how to sum specific cells.
 Can excel import xml files
Mar 07, 2025 pm 02:43 PM
Can excel import xml files
Mar 07, 2025 pm 02:43 PM
Excel can import XML data using its built-in "From XML Data Import" function. Import success depends heavily on XML structure; well-structured files import easily, while complex ones may require manual mapping. Best practices include XML
 how to make a table in excel
Mar 14, 2025 pm 02:53 PM
how to make a table in excel
Mar 14, 2025 pm 02:53 PM
Article discusses creating, formatting, and customizing tables in Excel, and using functions like SUM, AVERAGE, and PivotTables for data analysis.
 how to calculate mean in excel
Mar 14, 2025 pm 03:33 PM
how to calculate mean in excel
Mar 14, 2025 pm 03:33 PM
Article discusses calculating mean in Excel using AVERAGE function. Main issue is how to efficiently use this function for different data sets.(158 characters)
 how to make pie chart in excel
Mar 14, 2025 pm 03:32 PM
how to make pie chart in excel
Mar 14, 2025 pm 03:32 PM
The article details steps to create and customize pie charts in Excel, focusing on data preparation, chart insertion, and personalization options for enhanced visual analysis.
 how to add drop down in excel
Mar 14, 2025 pm 02:51 PM
how to add drop down in excel
Mar 14, 2025 pm 02:51 PM
Article discusses creating, editing, and removing drop-down lists in Excel using data validation. Main issue: how to manage drop-down lists effectively.
