The internal structure and operating mechanism of JVM
1. Introduction to java memory composition: Heapandnon-heap(Non- heap)Memory
According to the official statement: "The Java virtual machine has a heap. The heap is the runtime data area, and the memory of all class instances and arrays is allocated from here.
The heap is created when the Java virtual machine starts." "The memory outside the heap in the JVM is called non-heap memory (Non-heap memory)." It can be seen that JVM mainly manages two types of memory: heap and non-heap.
Simply speaking, the heap is the memory accessible to Java code and is reserved for developers; the non-heap is the memory reserved for the JVM for its own use, so the memory required for method area, JVM internal processing or optimization ( Such as JIT compiled code cache), each class structure (such as runtime constant pool, field and method data) and the code of methods and constructors are in non-heap memory.
2. JVM memory area model
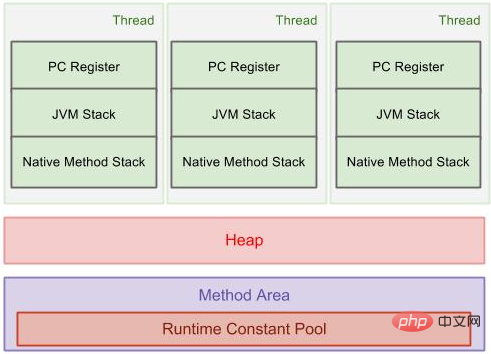
1. Method area Also known as "permanent generation" and "non-heap", it is used to store class information, constants, and static variables loaded by the virtual machine. It is a memory area shared by each thread. The default minimum value is 16MB and the maximum value is 64MB. You can limit the size of the method area through the -XX:PermSize and -XX:MaxPermSize parameters.
Runtime constant pool: It is part of the method area, the main content of which comes from the loading of Class by the JVM.
In addition to the description information such as class version, fields, methods, interfaces, etc., the Class file also has a constant pool, which is used to store various symbol references generated by the compiler. This part will be discussed in After the class is loaded, it is placed in the runtime constant pool in the method area.
2. Virtual machine stack
describes the memory model of java method execution: when each method is executed, a "stack frame" is created for storage Local variable table (including parameters), operation stack, method exit and other information. The process from each method being called to the completion of execution corresponds to the process of a stack frame from being pushed into the stack to being popped out of the stack in the virtual machine stack. The declaration cycle is the same as the thread and is private to the thread.
The local variable table stores various basic data types known to the compiler (boolean, byte, char, short, int, float, long, double), object reference (reference pointer, not the object itself), of which 64 bits Long and double type data will occupy the space of 2 local variables, and other data types will only occupy 1 space.
The memory space required for the local variable table is allocated during compilation. When entering a method, it is completely determined how many local variables this method needs to allocate in the stack frame. The stack frame will not Change the size of the local variable table.
3. The local method stack
is basically similar to the virtual machine stack. The difference is that the virtual machine stack serves the java methods executed by the virtual machine, while the local method stack is Serve Native methods.
4. Heap
Also called java heap, GC heap is the largest memory area in the memory managed by the java virtual machine, and is also the memory shared by each thread. Region, created when the JVM starts. This memory area stores object instances and arrays (all new objects).
The size is set by the -Xms (minimum value) and -Xmx (maximum value) parameters. -Xms is the minimum memory requested when the JVM starts. The default is 1/64 of the physical memory of the operating system but less than 1G. -Xmx is the maximum memory that the JVM can apply for. The default is 1/4 of the physical memory but less than 1G. By default, when the free heap memory is less than 40%, The JVM will increase the Heap to the size specified by -Xmx. You can specify this ratio through -XX:MinHeapFreeRation=; when the free heap memory is greater than 70%, the JVM will reduce the size. The size of the heap reaches the size specified by -Xms. You can specify this ratio through XX:MaxHeapFreeRation=. For the running system, in order to avoid frequently adjusting the size of the Heap at runtime, usually -Xms and -Xmx The values are set to the same.
Since collectors now use generational collection algorithms, the heap is divided into the new generation and the old generation. The new generation mainly stores newly created objects and objects that have not yet entered the old generation. The old generation stores objects that have survived multiple minor GCs.
New generation: New objects created by the program allocate memory from the new generation. The new generation consists of
Eden Spaceand twoSurvivor Spaceof the same size. (usually also called S0 and S1 or From and To), the size of the new generation can be specified through the -Xmn parameter, and theEden Spaceand-XX:SurvivorRationcan also be adjusted The size ofSurvivor Space.Old generation: used to store objects that have survived multiple times of new generation GC, such as cache objects. Newly created objects may also directly enter the old generation. There are two main situations:
1. Large objects can be set by startup parameters
-XX:PretenureSizeThreshold=1024(unit is bytes, default is 0) to represent that when it exceeds the size, it will not be allocated in the new generation, but directly in the new generation. Old generation allocation.2. For large array objects, there are no external objects referenced in the array. The memory size occupied by the old generation is the value corresponding to -Xmx minus the value corresponding to -Xmn.

Young Generation        即图中的Eden + From Space + To Space
Eden                    存放新生的对象
Survivor Space          有两个,存放每次垃圾回收后存活的对象
Old Generation          Tenured Generation 即图中的Old Space
                        主要存放应用程序中生命周期长的存活对象
5. The program counter
is the smallest memory area , its function is the line number indicator of the bytecode executed by the current thread. In the virtual machine model, the bytecode interpreter selects the next bytecode that needs to be executed by changing the value of this counter when working. Basic functions such as instructions, branches, loops, exception handling, and thread recovery all rely on counters.
3. Direct memory
Direct memory is not part of the virtual machine memory, nor is it a memory area defined in the Java virtual machine specification. The newly added NIO in jdk1.4 introduces the IO method of channel and buffer. It can call the Native method to directly allocate off-heap memory. This off-heap memory is the local memory and will not affect the size of the heap memory.
4. 10 Key Points of Java Heap Memory
Java heap memory is allocated by the operating system Part of the JVM's memory.
When we create objects, they are stored in Java heap memory.
To facilitate garbage collection, the Java heap space is divided into three areas , respectively called New Generation, Old Generation or Tenured Generation, and Perm Space.
You can adjust the size of the Java heap space by using the JVM command line options -Xms, -Xmx, -Xmn. Don't forget to add "M" or "G" after the size to indicate the unit. For example, you can use -Xmx256m to set the maximum heap size to 256MB.
You can use JConsole or Runtime.maxMemory(), Runtime.totalMemory(), Runtime.freeMemory() to view the size of the heap memory in Java.
You can use the command "jmap" to obtain the heap dump and "jhat" to analyze the heap dump.
Java heap space is different from stack space. Stack space is used to store call stacks and local variables.
The Java garbage collector is used to reclaim the memory occupied by dead objects (objects that are no longer used) and then release it into the Java heap space.
When you encounter java.lang.outOfMemoryError, don’t be nervous. Sometimes just increasing the heap space is enough, but if it occurs often, you need to check whether there is any problem in the Java program. There is no memory leak.
- Please use Profiler and Heap dump analysis tools to view the Java heap space and see how much memory is allocated to each object.
For more related knowledge, please pay attention to java basic tutorialcolumn
The above is the detailed content of The internal structure and operating mechanism of JVM. For more information, please follow other related articles on the PHP Chinese website!

Hot AI Tools

Undresser.AI Undress
AI-powered app for creating realistic nude photos

AI Clothes Remover
Online AI tool for removing clothes from photos.

Undress AI Tool
Undress images for free

Clothoff.io
AI clothes remover

Video Face Swap
Swap faces in any video effortlessly with our completely free AI face swap tool!

Hot Article

Hot Tools

Notepad++7.3.1
Easy-to-use and free code editor

SublimeText3 Chinese version
Chinese version, very easy to use

Zend Studio 13.0.1
Powerful PHP integrated development environment

Dreamweaver CS6
Visual web development tools

SublimeText3 Mac version
God-level code editing software (SublimeText3)

Hot Topics
 1387
1387
 52
52
 Perfect Number in Java
Aug 30, 2024 pm 04:28 PM
Guide to Perfect Number in Java. Here we discuss the Definition, How to check Perfect number in Java?, examples with code implementation.
 Weka in Java
Aug 30, 2024 pm 04:28 PM
Guide to Weka in Java. Here we discuss the Introduction, how to use weka java, the type of platform, and advantages with examples.
 Smith Number in Java
Aug 30, 2024 pm 04:28 PM
Guide to Smith Number in Java. Here we discuss the Definition, How to check smith number in Java? example with code implementation.
 Java Spring Interview Questions
Aug 30, 2024 pm 04:29 PM
In this article, we have kept the most asked Java Spring Interview Questions with their detailed answers. So that you can crack the interview.
 Break or return from Java 8 stream forEach?
Feb 07, 2025 pm 12:09 PM
Java 8 introduces the Stream API, providing a powerful and expressive way to process data collections. However, a common question when using Stream is: How to break or return from a forEach operation? Traditional loops allow for early interruption or return, but Stream's forEach method does not directly support this method. This article will explain the reasons and explore alternative methods for implementing premature termination in Stream processing systems. Further reading: Java Stream API improvements Understand Stream forEach The forEach method is a terminal operation that performs one operation on each element in the Stream. Its design intention is
 TimeStamp to Date in Java
Aug 30, 2024 pm 04:28 PM
Guide to TimeStamp to Date in Java. Here we also discuss the introduction and how to convert timestamp to date in java along with examples.
 Java Program to Find the Volume of Capsule
Feb 07, 2025 am 11:37 AM
Capsules are three-dimensional geometric figures, composed of a cylinder and a hemisphere at both ends. The volume of the capsule can be calculated by adding the volume of the cylinder and the volume of the hemisphere at both ends. This tutorial will discuss how to calculate the volume of a given capsule in Java using different methods. Capsule volume formula The formula for capsule volume is as follows: Capsule volume = Cylindrical volume Volume Two hemisphere volume in, r: The radius of the hemisphere. h: The height of the cylinder (excluding the hemisphere). Example 1 enter Radius = 5 units Height = 10 units Output Volume = 1570.8 cubic units explain Calculate volume using formula: Volume = π × r2 × h (4
 Create the Future: Java Programming for Absolute Beginners
Oct 13, 2024 pm 01:32 PM
Java is a popular programming language that can be learned by both beginners and experienced developers. This tutorial starts with basic concepts and progresses through advanced topics. After installing the Java Development Kit, you can practice programming by creating a simple "Hello, World!" program. After you understand the code, use the command prompt to compile and run the program, and "Hello, World!" will be output on the console. Learning Java starts your programming journey, and as your mastery deepens, you can create more complex applications.


