

Efficient data processing in Python worth a look

##Worth-seeing Python efficient data processing
Pandas is a very commonly used data processing tool in Python and is very convenient to use. It is built on the NumPy array structure, so many of its operations are written through the extension modules that come with NumPy or Pandas. These modules are written in Cython and compiled into C, and are executed on C, thus ensuring the processing speed. Today we will experience its power.1. Create data
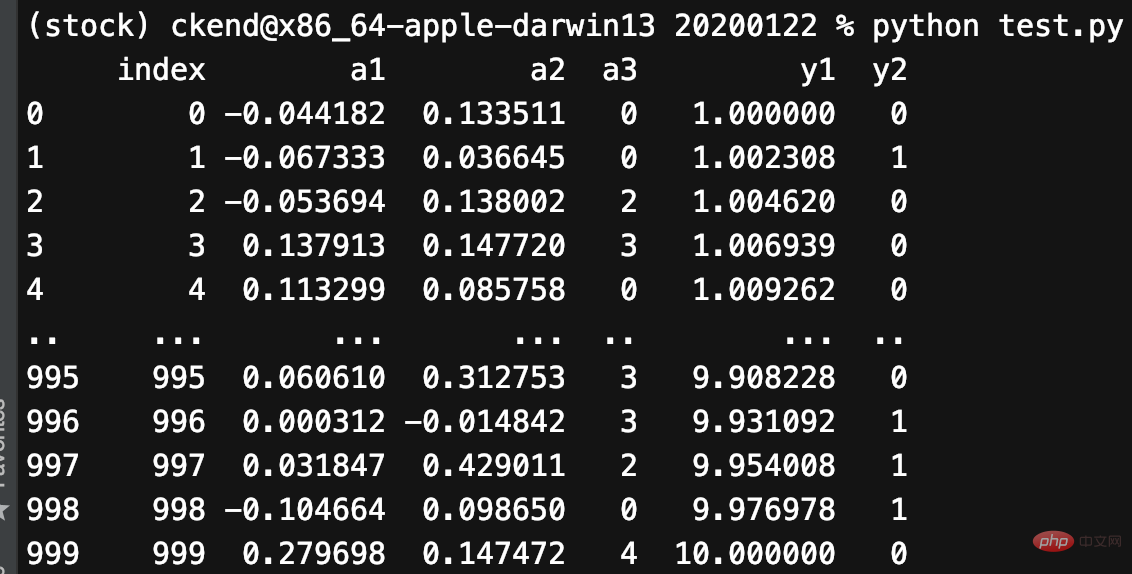
Using pandas can easily create data. Now let us create a pandas DataFrame with 5 columns and 1000 rows:mu1, sigma1 = 0, 0.1
mu2, sigma2 = 0.2, 0.2
n = 1000df = pd.DataFrame(
{
"a1": pd.np.random.normal(mu1, sigma1, n),
"a2": pd.np.random.normal(mu2, sigma2, n),
"a3": pd.np.random.randint(0, 5, n),
"y1": pd.np.logspace(0, 1, num=n),
"y2": pd.np.random.randint(0, 2, n),
}
)- a1 and a2: Random samples drawn from a normal (Gaussian) distribution.
- a3: Random integer from 0 to 4.
- y1: uniformly distributed on a logarithmic scale from 0 to 1.
- y2: Random integer from 0 to 1.
2. Draw the image
Pandas drawing function Returns a matplotlib coordinate axis (Axes), so we can customize what we need on it. For example, draw a vertical line and a parallel line. This will be very beneficial to us:1. Draw the average line
2. Mark the important points
import matplotlib.pyplot as plt
ax = df.y1.plot()
ax.axhline(6, color="red", linestyle="--")
ax.axvline(775, color="red", linestyle="--")
plt.show()

fig, ax = plt.subplots(2, 2, figsize=(14,7))
df.plot(x="index", y="y1", ax=ax[0, 0])
df.plot.scatter(x="index", y="y2", ax=ax[0, 1])
df.plot.scatter(x="index", y="a3", ax=ax[1, 0])
df.plot(x="index", y="a1", ax=ax[1, 1])
plt.show()

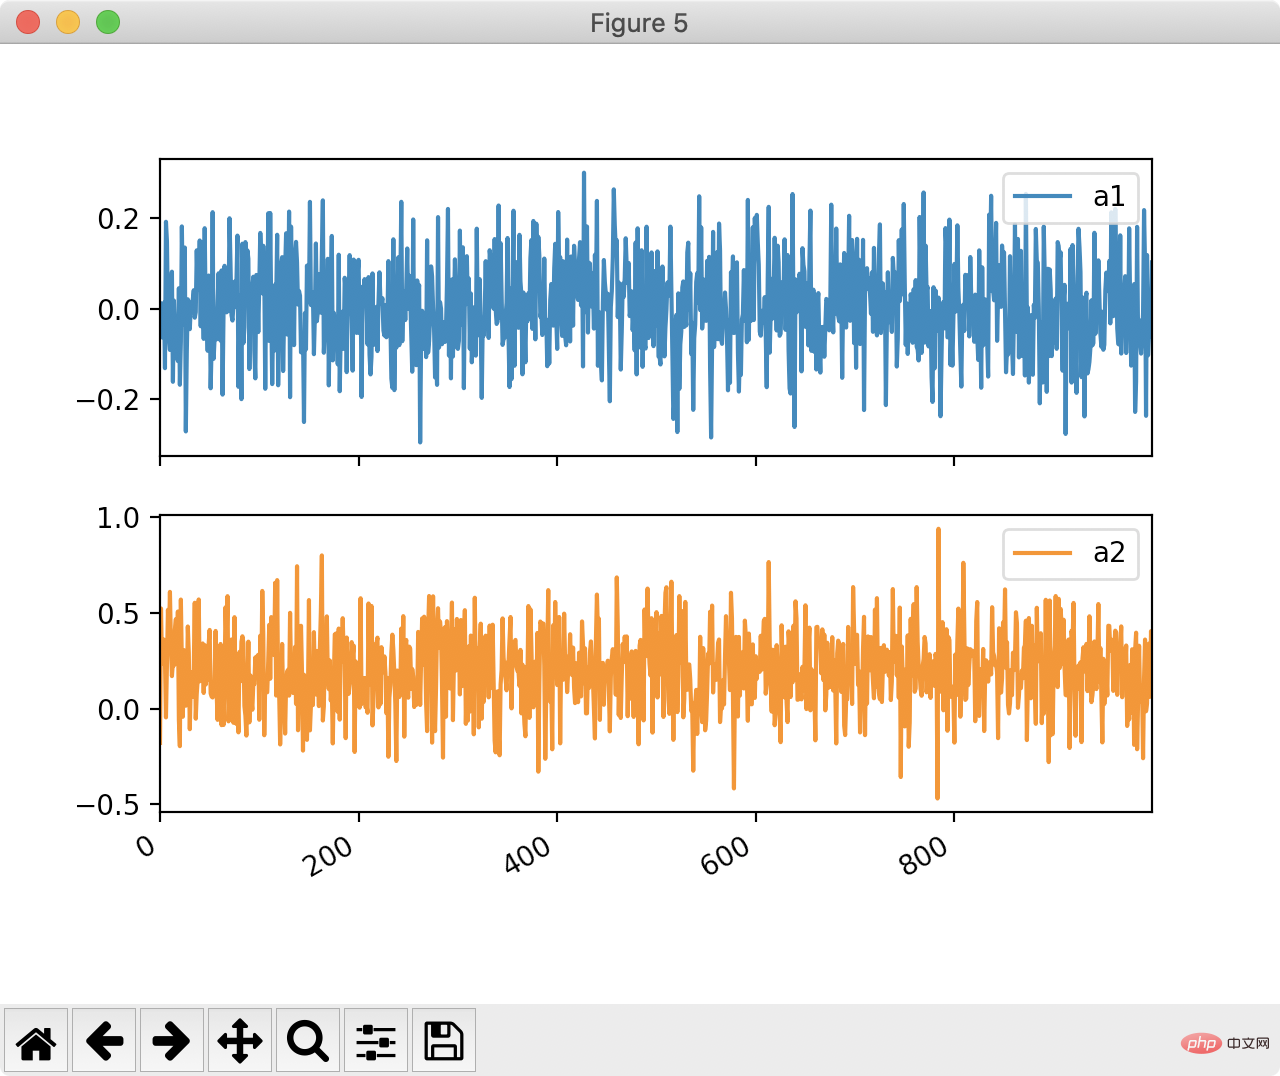
3. Draw a histogram
Pandas allows us to obtain the shape comparison of two graphics in a very simple way:df[["a1", "a2"]].plot(bins=30, kind="hist") plt.show()

df[["a1", "a2"]].plot(bins=30, kind="hist", subplots=True)
plt.show()

df[['a1', 'a2']].plot(by=df.y2, subplots=True)
plt.show()
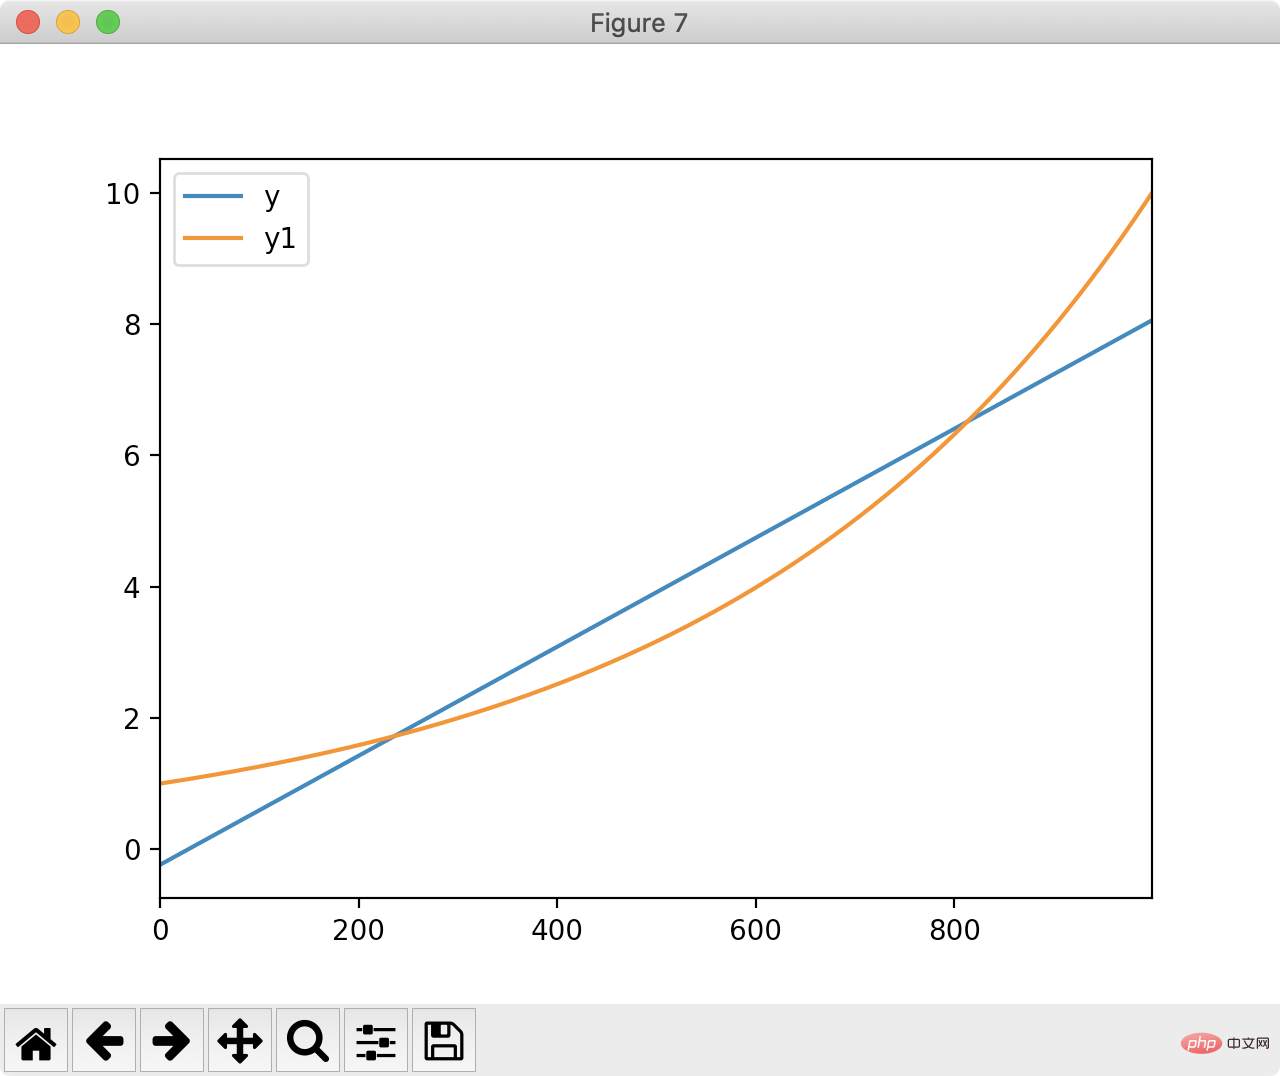
4. Linear fitting
Pandas can also be used for fitting. Let us use pandas to find a straight line closest to the following figure:
df['ones'] = pd.np.ones(len(df))
m, c = pd.np.linalg.lstsq(df[['index', 'ones']], df['y1'], rcond=None)[0]
df['y'] = df['index'].apply(lambda x: x * m + c)
df[['y', 'y1']].plot()
plt.show()
The above is the detailed content of Efficient data processing in Python worth a look. For more information, please follow other related articles on the PHP Chinese website!

Hot AI Tools

Undresser.AI Undress
AI-powered app for creating realistic nude photos

AI Clothes Remover
Online AI tool for removing clothes from photos.

Undress AI Tool
Undress images for free

Clothoff.io
AI clothes remover

AI Hentai Generator
Generate AI Hentai for free.

Hot Article
Hot Tools

Notepad++7.3.1
Easy-to-use and free code editor

SublimeText3 Chinese version
Chinese version, very easy to use

Zend Studio 13.0.1
Powerful PHP integrated development environment

Dreamweaver CS6
Visual web development tools

SublimeText3 Mac version
God-level code editing software (SublimeText3)
Hot Topics


 Can the Python interpreter be deleted in Linux system?
Apr 02, 2025 am 07:00 AM
Can the Python interpreter be deleted in Linux system?
Apr 02, 2025 am 07:00 AM
Regarding the problem of removing the Python interpreter that comes with Linux systems, many Linux distributions will preinstall the Python interpreter when installed, and it does not use the package manager...
 How to solve the problem of Pylance type detection of custom decorators in Python?
Apr 02, 2025 am 06:42 AM
How to solve the problem of Pylance type detection of custom decorators in Python?
Apr 02, 2025 am 06:42 AM
Pylance type detection problem solution when using custom decorator In Python programming, decorator is a powerful tool that can be used to add rows...
 Python asyncio Telnet connection is disconnected immediately: How to solve server-side blocking problem?
Apr 02, 2025 am 06:30 AM
Python asyncio Telnet connection is disconnected immediately: How to solve server-side blocking problem?
Apr 02, 2025 am 06:30 AM
About Pythonasyncio...
 How to solve permission issues when using python --version command in Linux terminal?
Apr 02, 2025 am 06:36 AM
How to solve permission issues when using python --version command in Linux terminal?
Apr 02, 2025 am 06:36 AM
Using python in Linux terminal...
 Python 3.6 loading pickle file error ModuleNotFoundError: What should I do if I load pickle file '__builtin__'?
Apr 02, 2025 am 06:27 AM
Python 3.6 loading pickle file error ModuleNotFoundError: What should I do if I load pickle file '__builtin__'?
Apr 02, 2025 am 06:27 AM
Loading pickle file in Python 3.6 environment error: ModuleNotFoundError:Nomodulenamed...
 Do FastAPI and aiohttp share the same global event loop?
Apr 02, 2025 am 06:12 AM
Do FastAPI and aiohttp share the same global event loop?
Apr 02, 2025 am 06:12 AM
Compatibility issues between Python asynchronous libraries In Python, asynchronous programming has become the process of high concurrency and I/O...
 What should I do if the '__builtin__' module is not found when loading the Pickle file in Python 3.6?
Apr 02, 2025 am 07:12 AM
What should I do if the '__builtin__' module is not found when loading the Pickle file in Python 3.6?
Apr 02, 2025 am 07:12 AM
Error loading Pickle file in Python 3.6 environment: ModuleNotFoundError:Nomodulenamed...
 How to ensure that the child process also terminates after killing the parent process via signal in Python?
Apr 02, 2025 am 06:39 AM
How to ensure that the child process also terminates after killing the parent process via signal in Python?
Apr 02, 2025 am 06:39 AM
The problem and solution of the child process continuing to run when using signals to kill the parent process. In Python programming, after killing the parent process through signals, the child process still...
