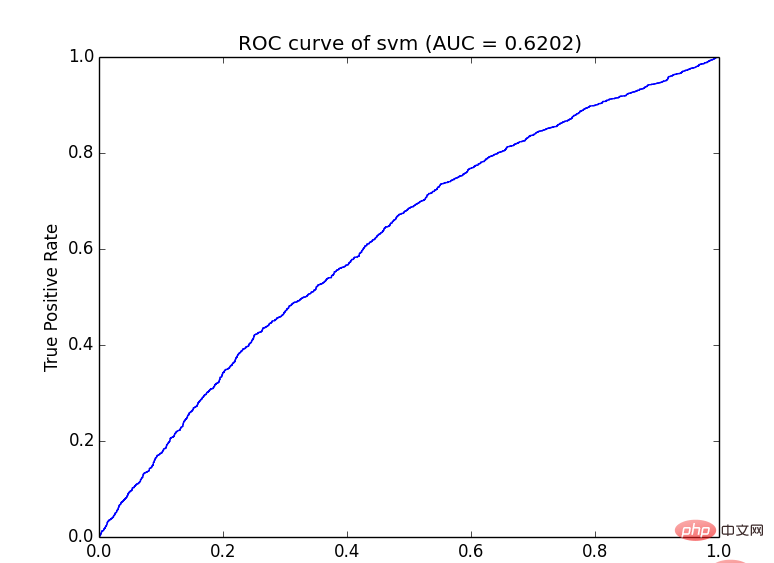

1. Preparation of calculation data, which is generally used if there is only a training set during model training. Calculated by cross-validation, if there is an evaluation set (evaluate), it can usually be calculated directly. The format of the data generally requires the predicted score and its target category (note that it is the target category, not the predicted category)Go directly to the python code2. According to the threshold division, the horizontal (X: False Positive Rate) and vertical (Y: True Positive Rate) points are obtained
3. After connecting the coordinate points into a curve, calculate the area under the curve, which is the value of AUC
#! -*- coding=utf-8 -*-import pylab as pl
from math import log,exp,sqrt


evaluate_result="you file path"db = [] #[score,nonclk,clk]pos, neg = 0, 0
with open(evaluate_result,'r') as fs: for line in fs:
 nonclk,clk,score = line.strip().split('\t')
 nonclk = int(nonclk)
 clk = int(clk)
 score = float(score)
 db.append([score,nonclk,clk])
 pos += clk
 neg += nonclk


db = sorted(db, key=lambda x:x[0], reverse=True)
 #计算ROC坐标点xy_arr = []tp, fp = 0., 0.
for i in range(len(db)):
 tp += db[i][2]
 fp += db[i][1]
 xy_arr.append([fp/neg,tp/pos])
 #计算曲线下面积auc = 0.
prev_x = 0for x,y in xy_arr: if x != prev_x:
 auc += (x - prev_x) * y
 prev_x = x

print "the auc is %s."%auc
 x = [_v[0] for _v in xy_arr]
y = [_v[1] for _v in xy_arr]
pl.title("ROC curve of %s (AUC = %.4f)" % ('svm',auc))
pl.xlabel("False Positive Rate")
pl.ylabel("True Positive Rate")
pl.plot(x, y)# use pylab to plot x and y
pl.show()# show the plot on the screennonclk \t clk \t score
1, nonclick: non-clicked data, which can be regarded as the number of negative samples
2 , clk: the number of clicks, which can be regarded as the number of positive samples
3, score: predicted score, using this score as a group to perform pre-statistics of positive and negative samples can reduce the amount of AUC calculation
The result of the operation is :

NoteThe code posted above:
1. Only the results of the two categories can be calculated (as for the labels of the two categories, you can handle them casually)
2. Each score in the above code has a threshold. In fact, this efficiency is quite low. You can sample the sample or Calculate equal parts when calculating the horizontal axis coordinates
Thank you very much for reading
When I was in college, I chose to learn Python by myself. When I started working, I found that I suffered from poor computer basics. There is nothing I can do if I don’t have good academic qualifications. I can make up for it the day after tomorrow, so I started my own counterattack outside of coding. I continued to learn the core knowledge of python and studied basic computer knowledge in depth. After sorting it out, I posted it on our WeChat public account "Programmer Academy". If you are not willing to be mediocre, then join me and continue to grow outside of coding!
Recommended tutorial: "
python tutorialThe above is the detailed content of Python draws ROC curve and calculates AUC value (with code). For more information, please follow other related articles on the PHP Chinese website!