 Backend Development
 PHP7
PHP7
 How to use xhprof to test php performance in php7? (Method introduction)
How to use xhprof to test php performance in php7? (Method introduction)

Introduction
1 Background
PHP's xhprof extension Facebook will no longer be updated and maintained because Facebook has fully used HHVM and no longer uses the PHP zend engine.
xhprof does not support the new version of PHP (PHP7). The tideways extension is maintained from the xhprof project fork and currently supports PHP 7.2, 7.1, 7.0, 5.6 and 5.5.
tideways is an open source project. It only charges for UI services. In fact, xhgui can fully meet our daily needs
# #2 Function
Tideways is an extension used to test PHP performance. It can obtain the functions called during the entire process of PHP execution, the number of function calls, execution time, CPU time, and memory usage. , memory peak, total execution time, total CPU time, total memory usage, total memory peak and other data, analyze the above data to find out the performance bottleneck of PHP, analyze the PHP execution process, etc.3 Advantages
- tideways is a PHP extension, combined with xhgui, there is no need to bury it in the PHP code Monitoring code
- You can set the execution frequency (for example, 1/100) without generating execution logs for every request, resulting in performance loss; you can also actively control whether to generate execution logs by requesting Parameters to control (debug=1)
- There is a simple and direct UI to transform data
- You can freely match the conditions for data filtering. For example, analyze a specific interface, analyze the interface request situation in a certain time period, etc.
4 Disadvantages
Although non-intrusive, if execution logs are generated for each interface, the consumption of CPU and memory is not negligible.5 Implementation principle
- tideways extension is responsible for generating running logs
- In nginx, by configuring fastcgi_param PHP_VALUE auto_prepend_file, Execute the PHP file configured with auto_prepend_file before the request starts. The register_shutdown_function method is used in the file. At the end of the PHP process, tideways_disable is called to realize the embedding of tideways. Then the execution log is stored in mongodb or mysql or a file, and displayed after analysis by xhgui. , display formats include bar chart, waterfall flow, and flame chart.
Application
Next, we will introduce two application methods:IntrusiveandNon-invasive
The intrusive type refers to adding code to the code, and the intrusive type uses the default UI; The non-intrusive type refers to adding code without making any changes to the code. Modify nginx/apache to implement code injection, using xhgui non-invasively; Installationtideways_xhprof
git clone "https://github.com/tideways/php-xhprof-extension.git"
cd php-xhprof-extension
phpize
./configure --with-php-config=/usr/local/php7/bin/php-config
make
sudo make install
##Non-intrusive:<?php
tideways_xhprof_enable();
// your application code
$data = tideways_xhprof_disable();
file_put_contents(
sys_get_temp_dir() . "/" . uniqid() . ".yourapp.xhprof",
serialize($data)
);
// $data = tideways_xhprof_disable();
// file_put_contents(
// sys_get_temp_dir() . "/" . date('His', time()) . ".material.xhprof",
// serialize($data)
// );
Installs the default UI used to find datagit clone git@github.com:phacility/xhprof.git
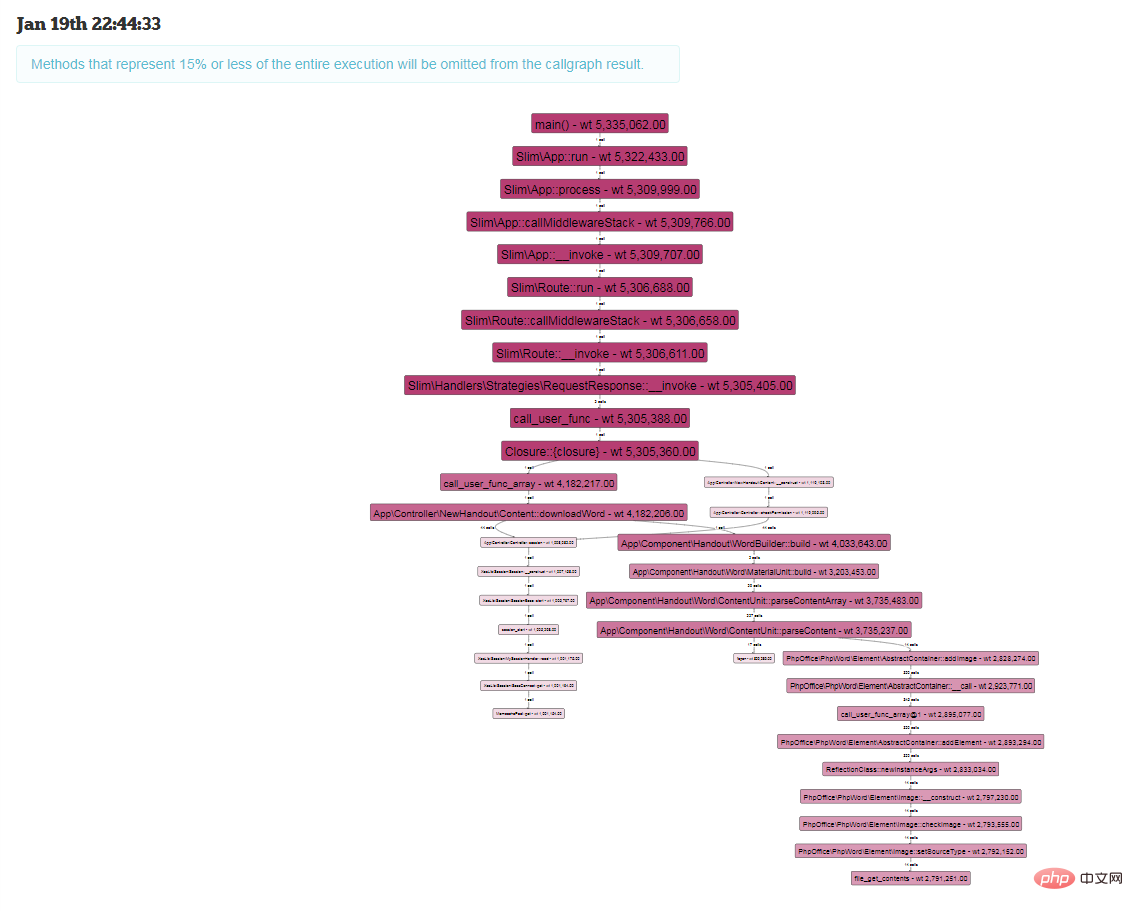
and in this repository xhprof_html directory into your web folder and navigate to xhprof_html/index.php to see the trace list. If you want to see function call notes, you need to install Callgraph
Install CallgraphCallgraph is actually a combination of three tools become.
One is cflow or calltree which is used to generate C function call tree. The following mainly introduces cflow.
A tool for processing dot text graphics language, enhanced by graphviz.
A script for converting C function call tree to dot format: tree2dotx
Take Ubuntu as an example, install them separately:
sudo apt-get install cflow graphviz
Next install tree2dotx and Callgraph , here they are installed to /usr/local/bin by default.
wget -c https://github.com/tinyclub/linux-0.11-lab/raw/master/tools/tree2dotx
wget -c https://github.com/tinyclub/linux-0.11-lab/raw/master/tools/callgraph
sudo cp tree2dotx callgraph /usr/local/bin
sudo chmod +x /usr/local/bin/{tree2dotx,callgraph}The next two renderings are shown:
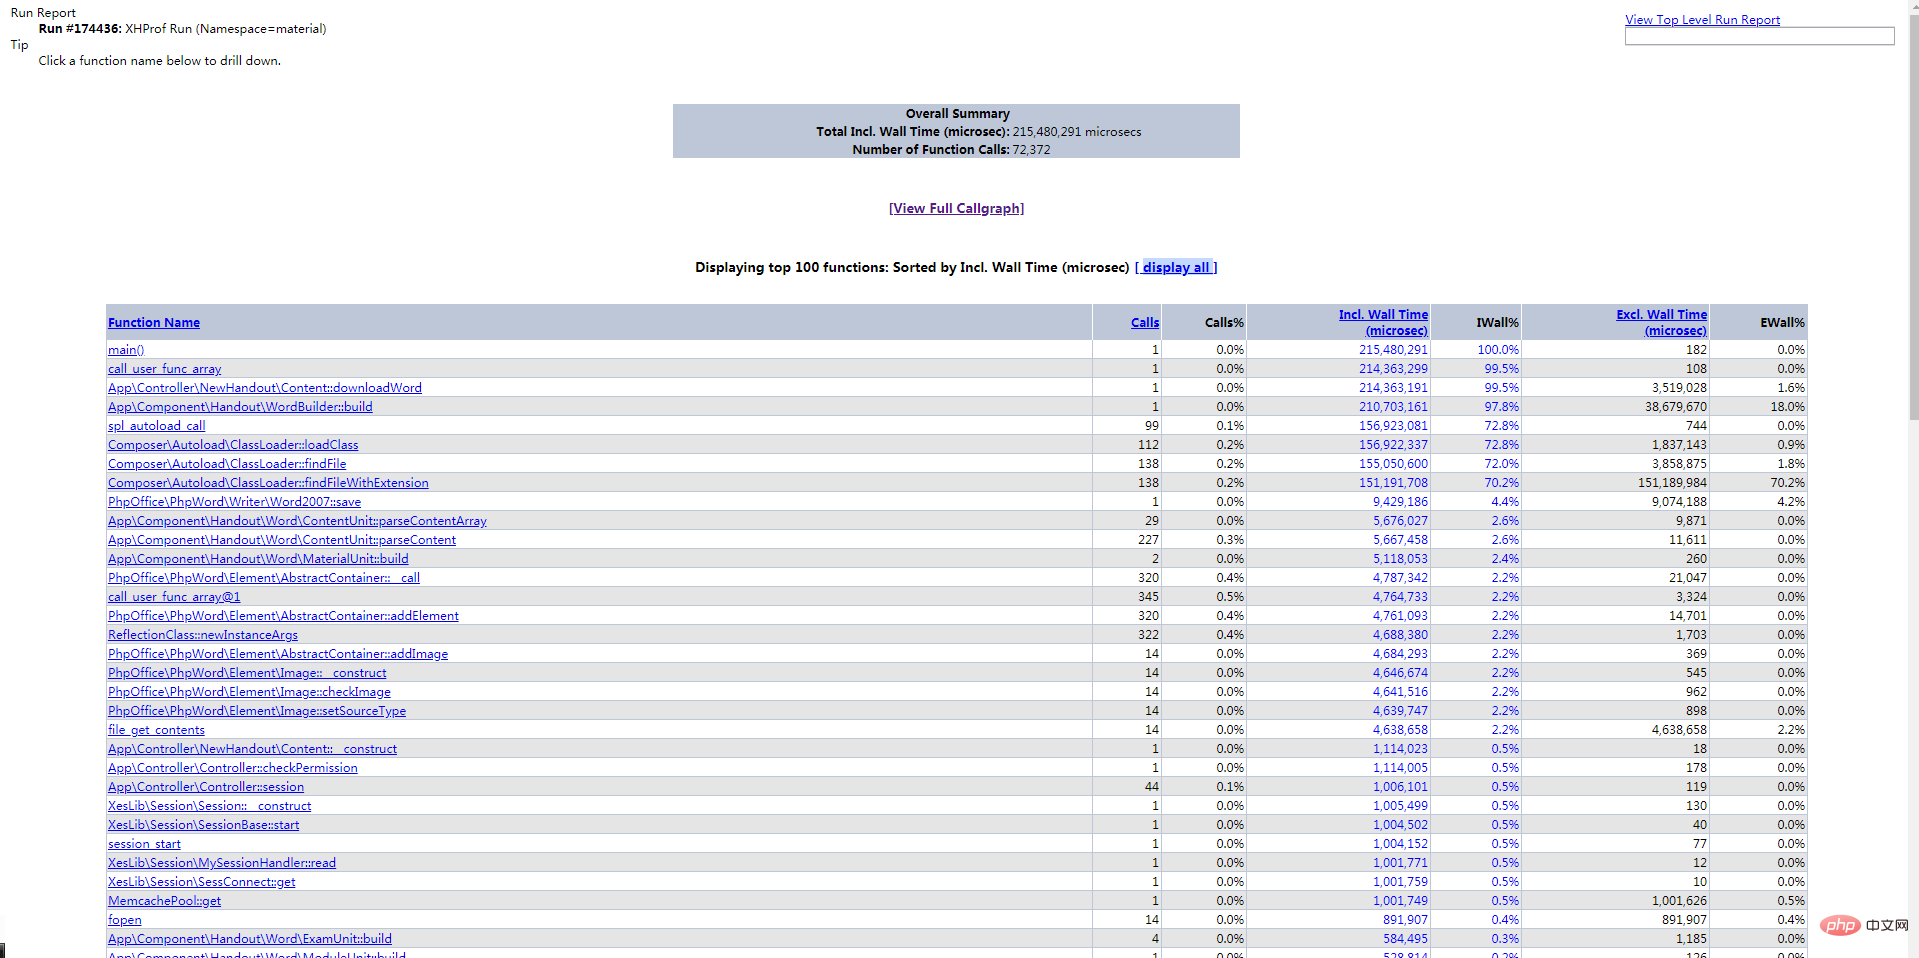
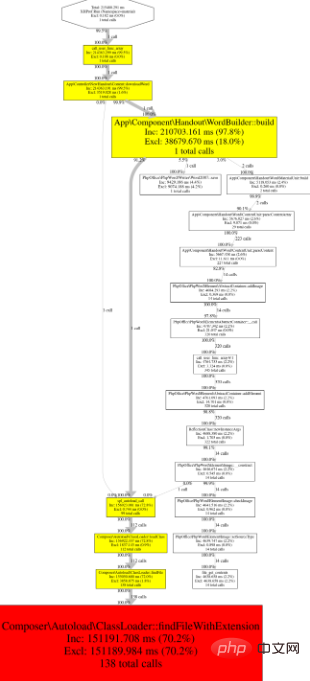
Intrusive: Intrusive use of xhgui requires mongodb
Install xhguigit clone git@github.com:perftools/xhgui.git
Configure Nginxserver {
listen 80;
server_name site.localhost;
root /Users/markstory/Sites/awesome-thing/app/webroot/;
fastcgi_param PHP_VALUE "auto_prepend_file=/home/www/xhgui/external/header.php"; #这里依据个人目录而配
}
xhgui configuration (Frequency of generating logs)In xhgui’s config/config.default.php, the number of sampling hits can be set;
return rand(1, 100) === 42; 为1%的采样率,改成return True;则标识每次都采样
'profiler.enable' => function() {
   // url 中包含debug=1则百分百捕获
   if(!empty($_GET['debug'])){
       return True;
   }else{
       // 1%采样
       return rand(1, 100) === 42;
   }
}mongodb的配置
xhgui/config/config.default.php
// Can be either mongodb or file.
   /*
   'save.handler' => 'file',
   'save.handler.filename' => dirname(__DIR__) . '/cache/' . 'xhgui.data.' . microtime(true) . '_' . substr(md5($url), 0, 6),
   */
   'save.handler' => 'mongodb',
   // Needed for file save handler. Beware of file locking. You can adujst this file path
   // to reduce locking problems (eg uniqid, time ...)
   //'save.handler.filename' => __DIR__.'/../data/xhgui_'.date('Ymd').'.dat',
   'db.host' => 'mongodb://127.0.0.1:27017',
'db.db' => 'xhprof',mongo服务器的配置
mongo
 > use xhprof
 > db.results.ensureIndex( { 'meta.SERVER.REQUEST_TIME' : -1 } )
 > db.results.ensureIndex( { 'profile.main().wt' : -1 } )
 > db.results.ensureIndex( { 'profile.main().mu' : -1 } )
 > db.results.ensureIndex( { 'profile.main().cpu' : -1 } )
> db.results.ensureIndex( { 'meta.url' : 1 } )最后展示几张xhgui的效果图
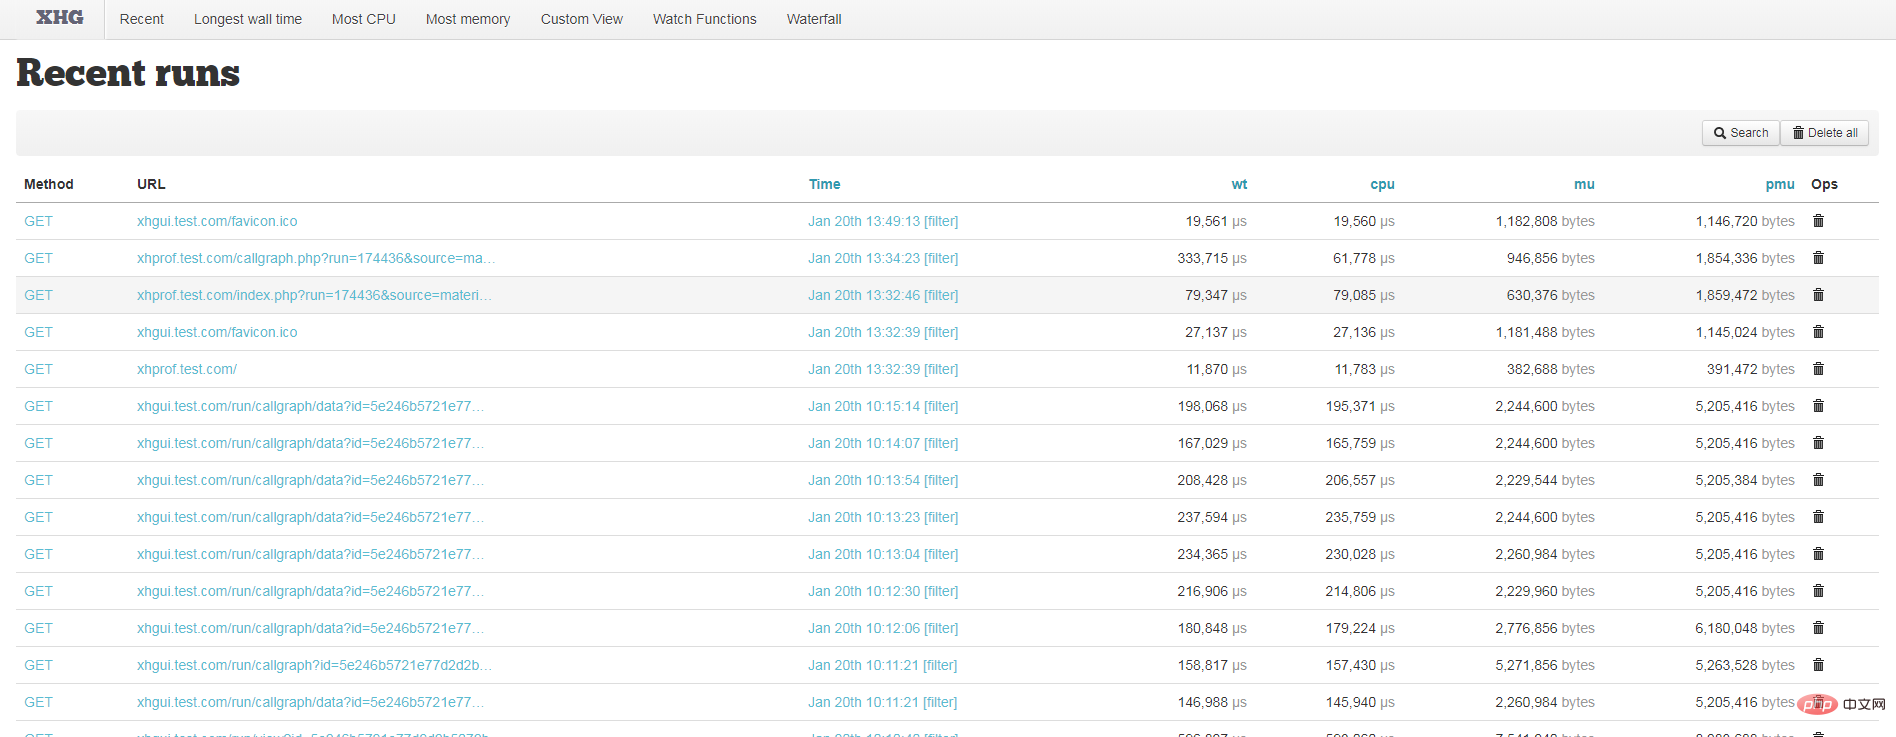
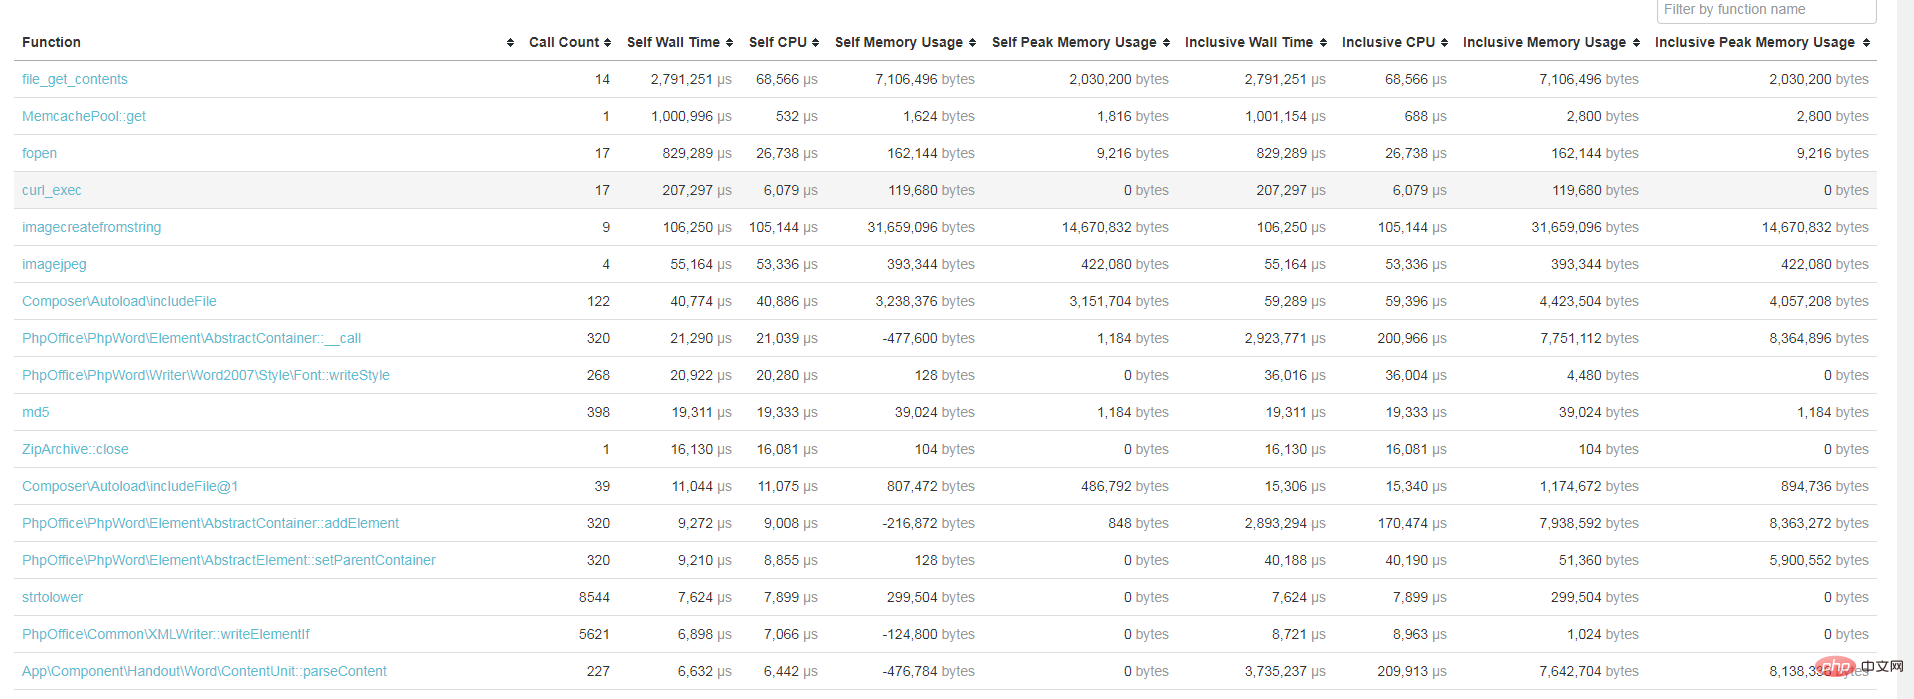
相关学习推荐:PHP编程从入门到精通
The above is the detailed content of How to use xhprof to test php performance in php7? (Method introduction). For more information, please follow other related articles on the PHP Chinese website!

Hot AI Tools

Undresser.AI Undress
AI-powered app for creating realistic nude photos

AI Clothes Remover
Online AI tool for removing clothes from photos.

Undress AI Tool
Undress images for free

Clothoff.io
AI clothes remover

AI Hentai Generator
Generate AI Hentai for free.

Hot Article

Hot Tools

Notepad++7.3.1
Easy-to-use and free code editor

SublimeText3 Chinese version
Chinese version, very easy to use

Zend Studio 13.0.1
Powerful PHP integrated development environment

Dreamweaver CS6
Visual web development tools

SublimeText3 Mac version
God-level code editing software (SublimeText3)

Hot Topics
 How to solve the problem when php7 detects that the tcp port is not working
Mar 22, 2023 am 09:30 AM
In php5, we can use the fsockopen() function to detect the TCP port. This function can be used to open a network connection and perform some network communication. But in php7, the fsockopen() function may encounter some problems, such as being unable to open the port, unable to connect to the server, etc. In order to solve this problem, we can use the socket_create() function and socket_connect() function to detect the TCP port.
 How to install mongo extension in php7.0
Nov 21, 2022 am 10:25 AM
How to install the mongo extension in php7.0: 1. Create the mongodb user group and user; 2. Download the mongodb source code package and place the source code package in the "/usr/local/src/" directory; 3. Enter "src/" directory; 4. Unzip the source code package; 5. Create the mongodb file directory; 6. Copy the files to the "mongodb/" directory; 7. Create the mongodb configuration file and modify the configuration.
 What should I do if the plug-in is installed in php7.0 but it still shows that it is not installed?
Apr 02, 2024 pm 07:39 PM
To resolve the plugin not showing installed issue in PHP 7.0: Check the plugin configuration and enable the plugin. Restart PHP to apply configuration changes. Check the plugin file permissions to make sure they are correct. Install missing dependencies to ensure the plugin functions properly. If all other steps fail, rebuild PHP. Other possible causes include incompatible plugin versions, loading the wrong version, or PHP configuration issues.
 How to use PHP for performance analysis and tuning
Jun 06, 2023 pm 01:21 PM
As a popular server-side language, PHP plays an important role in website development and operation. However, as the amount of PHP code continues to increase and the complexity of applications increases, performance bottlenecks become more and more likely to occur. In order to avoid this problem, we need to perform performance analysis and tuning. This article will briefly introduce how to use PHP for performance analysis and tuning to provide a more efficient running environment for your applications. 1. PHP performance analysis tool 1.XdebugXdebug is a widely used code analysis tool.
 Which one is better, php8 or php7?
Nov 16, 2023 pm 03:09 PM
Compared with PHP7, PHP8 has some advantages and improvements in terms of performance, new features and syntax improvements, type system, error handling and extensions. However, choosing which version to use depends on your specific needs and project circumstances. Detailed introduction: 1. Performance improvement, PHP8 introduces the Just-in-Time (JIT) compiler, which can improve the execution speed of the code; 2. New features and syntax improvements, PHP8 supports the declaration of named parameters and optional parameters, making functions Calling is more flexible; anonymous classes, type declarations of properties, etc. are introduced.
 How to install and deploy php7.0
Nov 30, 2022 am 09:56 AM
How to install and deploy php7.0: 1. Go to the PHP official website to download the installation version corresponding to the local system; 2. Extract the downloaded zip file to the specified directory; 3. Open the command line window and go to the "E:\php7" directory Just run the "php -v" command.
 PHP Server Environment FAQ Guide: Quickly Solve Common Problems
Apr 09, 2024 pm 01:33 PM
Common solutions for PHP server environments include ensuring that the correct PHP version is installed and that relevant files have been copied to the module directory. Disable SELinux temporarily or permanently. Check and configure PHP.ini to ensure that necessary extensions have been added and set up correctly. Start or restart the PHP-FPM service. Check the DNS settings for resolution issues.
 Record once and use strace to diagnose the problem of PHP occupying too much system resources.
May 03, 2024 pm 04:31 PM
Local environment: redhat6.7 system. nginx1.12.1, php7.1.0, the code uses the yii2 framework problem: the local web site needs to use the elasticsearch service. When PHP uses elasticsearch built on a local server, the local load is normal. When I use AWS's elasticsearch service, the load on the local server is often too high. Check the nginx and php logs and find no exceptions. The number of concurrent connections in the system is also not high. At this time, I thought of a strace diagnostic tool that our boss told me. Debugging process: Find a php sub-process idstrace-


