

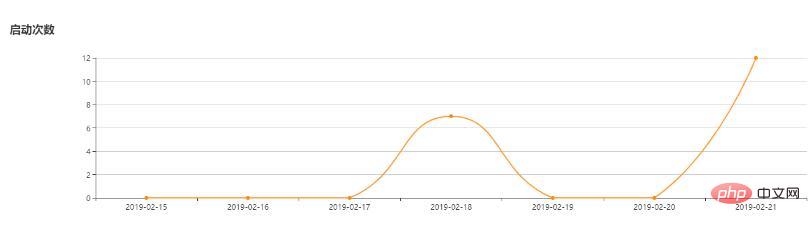
Implement Echarts in Vue to change with the form


<p id="myChart" :style="{width: '100%', height: '345px'}"></p>
<script> export default {
mounted(){
this.drawLine();
},
methods: {
drawLine(){
var myChartContainer = document.getElementById('myChart'); //用于使chart自适应宽度,通过窗体宽计算容器高宽
var resizeMyChartContainer = function(){
myChartContainer.style.width=(document.body.clientWidth-75)+'px'
} //设置容器高宽
resizeMyChartContainer()
// 基于准备好的dom,初始化echarts实例
var myChart = this.$echarts.init(myChartContainer)
// 绘制图表
myChart.setOption({
title: { text: '启动次数' },
tooltip: {},
xAxis: {
type: 'category',
data: ['2019-02-15', '2019-02-16', '2019-02-17', '2019-02-18', '2019-02-19', '2019-02-20', '2019-02-21']
},
yAxis: {
type:'value'
},
series: [{
type: 'line',
data: [0,0, 0, 7, 0, 0,12],
smooth:true,
symbol: 'circle',
symbolSize: 6,
itemStyle:{
normal:{
color:'#fc8a0f',
lineStyle:{
color:'#ff9c35'
}
}
}
}],
});
window.onresize=function(){
resizeMyChartContainer();
myChart.resize();
}
}
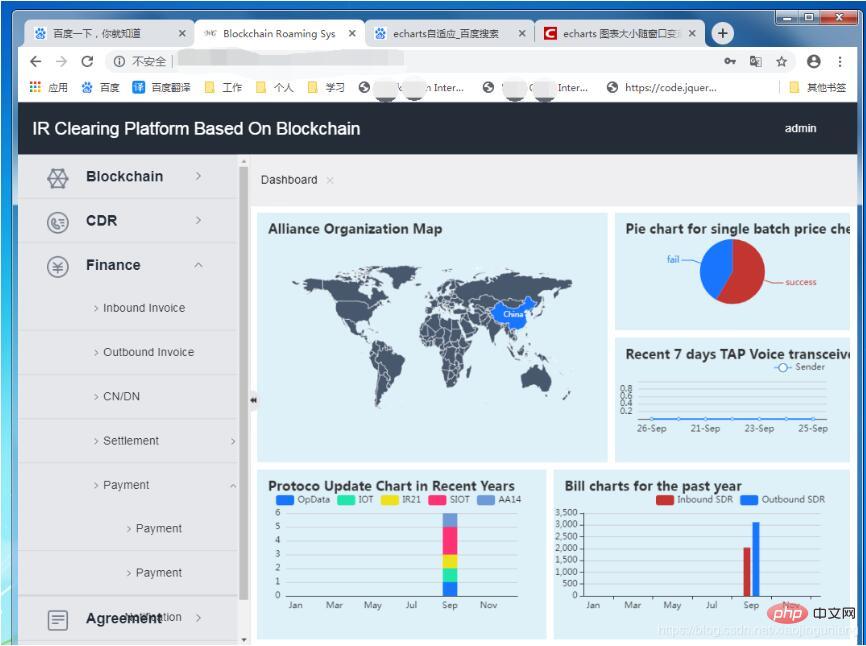
}}</script>Supplementary knowledge: echarts chart size changes adaptively as the window changes (No need to refresh the browser to adjust)
Question:
After using echars to make charts, you need to make adaptive effects according to the zoom of the browser window.
Cause analysis and solution:
The icon instance of echars does not actually actively bind the resize() event , which means that the size change of the display area is not known internally. When you need to do some adaptive effects, you need to actively bind this time to achieve the effect of self-use. Common ones are window.onresize = myChart.resize( )
Example:
var map5 = echarts.init(document.getElementById('map5'));
  var option5 = {
    backgroundColor: '#def1f9',
    color: ['#c23531', '#1875ff'],
    title: {
      left: 10,
      top: 10,
      text: 'Bill charts for the past year'
    },
    // color: ['#1875ff', '#1fe6ab', '#eee119', '#ff3074', '#6f99d9'],
    legend: {
      top: 30,
      right: 30
    },
    tooltip: {},

    xAxis: {type: 'category'},
    yAxis: {},
    series: [
      {type: 'bar'},
      {type: 'bar'}
    ]
  }
  map5.setOption(option5);

  window.onresize = function () {
    setTimeout(function () {
      map1.resize()
      map2.resize()
      map3.resize()
      map4.resize()
      map5.resize()
    },10)
}Key points:
window.onresize = function () {
   map1.resize() ; // 如果有多个图标变动,可写多个
}Recommended tutorial:《 JS tutorial》
The above is the detailed content of Implement Echarts in Vue to change with the form. For more information, please follow other related articles on the PHP Chinese website!

Hot AI Tools

Undresser.AI Undress
AI-powered app for creating realistic nude photos

AI Clothes Remover
Online AI tool for removing clothes from photos.

Undress AI Tool
Undress images for free

Clothoff.io
AI clothes remover

AI Hentai Generator
Generate AI Hentai for free.

Hot Article
Hot Tools

Notepad++7.3.1
Easy-to-use and free code editor

SublimeText3 Chinese version
Chinese version, very easy to use

Zend Studio 13.0.1
Powerful PHP integrated development environment

Dreamweaver CS6
Visual web development tools

SublimeText3 Mac version
God-level code editing software (SublimeText3)
Hot Topics


 How to disable the change event in vue
May 09, 2024 pm 07:21 PM
How to disable the change event in vue
May 09, 2024 pm 07:21 PM
In Vue, the change event can be disabled in the following five ways: use the .disabled modifier to set the disabled element attribute using the v-on directive and preventDefault using the methods attribute and disableChange using the v-bind directive and :disabled
 Adaptation of Java framework and front-end Vue framework
Jun 01, 2024 pm 09:55 PM
Adaptation of Java framework and front-end Vue framework
Jun 01, 2024 pm 09:55 PM
The Java framework and Vue front-end adaptation implement communication through the middle layer (such as SpringBoot), and convert the back-end API into a JSON format that Vue can recognize. Adaptation methods include: using the Axios library to send requests to the backend and using the VueResource plug-in to send simplified API requests.
 How to use v-show in vue
May 09, 2024 pm 07:18 PM
How to use v-show in vue
May 09, 2024 pm 07:18 PM
The v-show directive is used to dynamically hide or show elements in Vue.js. Its usage is as follows: The syntax of the v-show directive: v-show="booleanExpression", booleanExpression is a Boolean expression that determines whether the element is displayed. The difference with v-if: v-show only hides/shows elements through the CSS display property, which optimizes performance; while v-if conditionally renders elements and recreates them after destruction.
 How to use elementui for render function in vue
May 09, 2024 pm 07:09 PM
How to use elementui for render function in vue
May 09, 2024 pm 07:09 PM
The render function is used to create the virtual DOM in a Vue.js application. In Element UI, you can integrate Element UI components into the render function by rendering the component directly, using JSX syntax, or using scopedSlots. When integrating, you need to import the Element UI library, set properties in kebab-case mode, and use scopedSlots to render slot content (if the component has slots).
 Nuxt.js: a practical guide
Oct 09, 2024 am 10:13 AM
Nuxt.js: a practical guide
Oct 09, 2024 am 10:13 AM
Nuxt is an opinionated Vue framework that makes it easier to build high-performance full-stack applications. It handles most of the complex configuration involved in routing, handling asynchronous data, middleware, and others. An opinionated director
 From PHP to Go or Front-end? The suggestions and confusions of reality from experienced people
Apr 01, 2025 pm 02:12 PM
From PHP to Go or Front-end? The suggestions and confusions of reality from experienced people
Apr 01, 2025 pm 02:12 PM
Confusion and the cause of choosing from PHP to Go Recently, I accidentally learned about the salary of colleagues in other positions such as Android and Embedded C in the company, and found that they are more...
 What are the AI tools for mock interviews?
Nov 28, 2024 pm 09:52 PM
What are the AI tools for mock interviews?
Nov 28, 2024 pm 09:52 PM
Mock interview AI tools are valuable tools for efficient candidate screening, saving recruiters time and effort. These tools include HireVue, Talview, Interviewed, iCIMS Video, and Eightfold AI. They provide automated, session-based assessments with benefits including efficiency, consistency, objectivity and scalability. When choosing a tool, recruiters should consider integrations, user-friendliness, accuracy, pricing, and support. Mock interviewing AI tools improve hiring speed, decision quality, and candidate experience.
 How to find the right training program for programmers' entry-level skills?
Apr 01, 2025 am 11:30 AM
How to find the right training program for programmers' entry-level skills?
Apr 01, 2025 am 11:30 AM
Programmers' "tickling" needs: From leisure to practice, this programmer friend has been a little idle recently and wants to improve his skills and achieve success through some small projects...
