Example of parsing PHP to generate chart pChart

pChart is an open source chart generation library, mainly involving 3 Classes: pChart.class, pData.class, pCache.class, which can generate more than 20 types Simple or complex charts, supporting common image formats such as PNG, JPG, and GIF. The data source can come from Database, CSV, or handwritten. To use this program PHP, you need to enable the GD service. Let’s take a look at the workflow of pChart first:
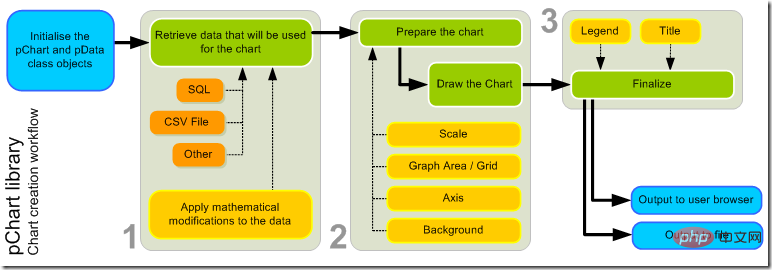
##Related learning recommendations:It is mainly divided into three steps:
- * Read the data (database, file) used to generate the chart
- * Design the chart style ( Rounded corners, background color, etc.)
- * Make labels, titles, legends and generate charts
<?php
// Standard inclusions
include("pChart/pData.class");
include("pChart/pChart.class");
// Dataset definition
$DataSet = new pData;
//图表数据
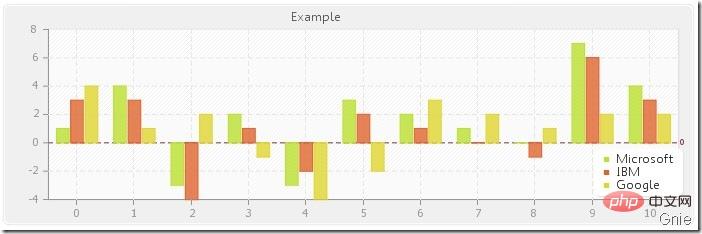
$DataSet->AddPoint(array(1,4,-3,2,-3,3,2,1,0,7,4),"Serie1");
$DataSet->AddPoint(array(3,3,-4,1,-2,2,1,0,-1,6,3),"Serie2");
$DataSet->AddPoint(array(4,1,2,-1,-4,-2,3,2,1,2,2),"Serie3");
$DataSet->AddAllSeries();
$DataSet->SetAbsciseLabelSerie();
//数据图例
$DataSet->SetSerieName("Microsoft","Serie1");
$DataSet->SetSerieName("IBM","Serie2");
$DataSet->SetSerieName("Google","Serie3");
// Initialise the graph
$Test = new pChart(700,230);
//设置图表尺寸、样式
$Test->setFontProperties("Fonts/tahoma.ttf",8);
$Test->setGraphArea(50,30,680,200);
$Test->drawFilledRoundedRectangle(7,7,693,223,5,240,240,240);
$Test->drawRoundedRectangle(5,5,695,225,5,230,230,230);
$Test->drawGraphArea(255,255,255,TRUE);
$Test->drawScale($DataSet->GetData(),$DataSet->GetDataDescription(),SCALE_NORMAL,150,150,150,TRUE,0,2,TRUE);
$Test->drawGrid(4,TRUE,230,230,230,50);
// Draw the 0 line
$Test->setFontProperties("Fonts/MankSans.ttf",6);
$Test->drawTreshold(0,143,55,72,TRUE,TRUE);
// Draw the bar graph
//柱状图要使用drawBarGraph()
$Test->drawBarGraph($DataSet->GetData(),$DataSet->GetDataDescription(),TRUE,80);
// Finish the graph
//制作图例、标题、字体等属性
$Test->setFontProperties("Fonts/MankSans.ttf",10);
$Test->drawLegend(596,150,$DataSet->GetDataDescription(),255,255,255);
$Test->setFontProperties("Fonts/MankSans.ttf",10);
$Test->drawTitle(50,22,"Example",50,50,50,585);
//生成图表
$imageFile = "example12.png";
$Test->Render($imageFile);
echo '<img src="'.$imageFile.'">';
?> ##Code:
<?php
// Standard inclusions
include("pChart/pData.class");
include("pChart/pChart.class");
// Dataset definition
$DataSet = new pData;
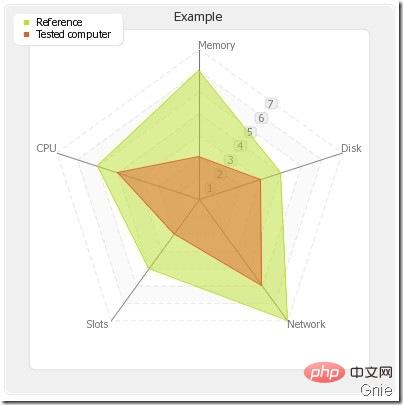
$DataSet->AddPoint(array("Memory","Disk","Network","Slots","CPU"),"Label");
$DataSet->AddPoint(array(6,4,7,4,5),"Serie1");
$DataSet->AddPoint(array(2,3,5,2,4),"Serie2");
$DataSet->AddSerie("Serie1");
$DataSet->AddSerie("Serie2");
$DataSet->SetAbsciseLabelSerie("Label");
$DataSet->SetSerieName("Reference","Serie1");
$DataSet->SetSerieName("Tested computer","Serie2");
// Initialise the graph
$Test = new pChart(400,400);
$Test->setFontProperties("Fonts/tahoma.ttf",8);
$Test->drawFilledRoundedRectangle(7,7,393,393,5,240,240,240);
$Test->drawRoundedRectangle(5,5,395,395,5,230,230,230);
$Test->setGraphArea(30,30,370,370);
$Test->drawFilledRoundedRectangle(30,30,370,370,5,255,255,255);
$Test->drawRoundedRectangle(30,30,370,370,5,220,220,220);
// Draw the radar graph
//要使用drawRadarAxis()生成雷达效果
$Test->drawRadarAxis($DataSet->GetData(),$DataSet->GetDataDescription(),TRUE,20,120,120,120,230,230,230);
$Test->drawFilledRadar($DataSet->GetData(),$DataSet->GetDataDescription(),50,20);
// Finish the graph
$Test->drawLegend(15,15,$DataSet->GetDataDescription(),255,255,255);
$Test->setFontProperties("Fonts/tahoma.ttf",10);
$Test->drawTitle(0,22,"Example",50,50,50,400);
$imageFile = "example8.png";
$Test->Render($imageFile);
echo '<img src="'.$imageFile.'">';
?>Let’s look at a few others The effect is
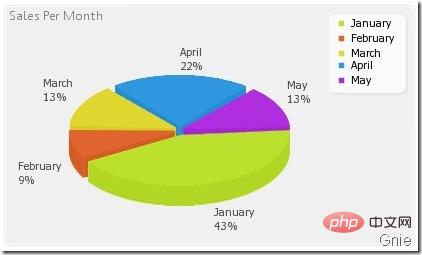
1, pie chart:
 2, two-coordinate curve chart:
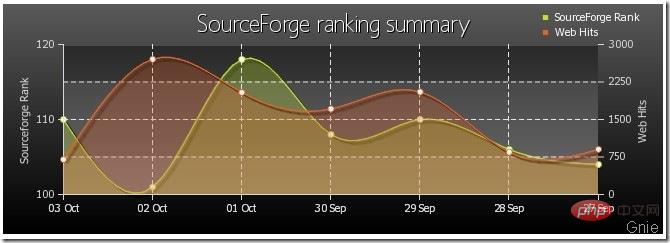 3, Stacked bar chart:
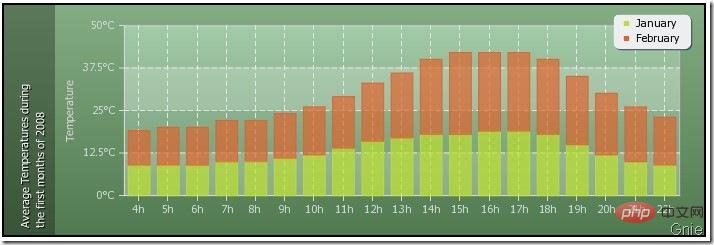 4, Multiple charts:
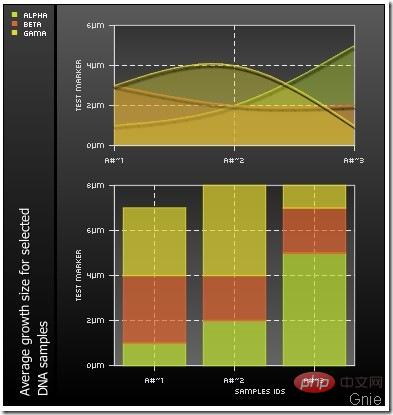 The types of charts are quite similar Enriched, please refer to
http://pchart.sourceforge.net/documentation.php?topic=pChart
::Source code download:::
http://xiazai.jb51.net/202007/yuanma/pChart_jb51.rar
The above is the detailed content of Example of parsing PHP to generate chart pChart. For more information, please follow other related articles on the PHP Chinese website!

Hot AI Tools

Undresser.AI Undress
AI-powered app for creating realistic nude photos

AI Clothes Remover
Online AI tool for removing clothes from photos.

Undress AI Tool
Undress images for free

Clothoff.io
AI clothes remover

Video Face Swap
Swap faces in any video effortlessly with our completely free AI face swap tool!

Hot Article

Hot Tools

Notepad++7.3.1
Easy-to-use and free code editor

SublimeText3 Chinese version
Chinese version, very easy to use

Zend Studio 13.0.1
Powerful PHP integrated development environment

Dreamweaver CS6
Visual web development tools

SublimeText3 Mac version
God-level code editing software (SublimeText3)

Hot Topics
 1386
1386
 52
52
 Alipay PHP SDK transfer error: How to solve the problem of 'Cannot declare class SignData'?
Apr 01, 2025 am 07:21 AM
Alipay PHP...
 Explain JSON Web Tokens (JWT) and their use case in PHP APIs.
Apr 05, 2025 am 12:04 AM
JWT is an open standard based on JSON, used to securely transmit information between parties, mainly for identity authentication and information exchange. 1. JWT consists of three parts: Header, Payload and Signature. 2. The working principle of JWT includes three steps: generating JWT, verifying JWT and parsing Payload. 3. When using JWT for authentication in PHP, JWT can be generated and verified, and user role and permission information can be included in advanced usage. 4. Common errors include signature verification failure, token expiration, and payload oversized. Debugging skills include using debugging tools and logging. 5. Performance optimization and best practices include using appropriate signature algorithms, setting validity periods reasonably,
 Describe the SOLID principles and how they apply to PHP development.
Apr 03, 2025 am 12:04 AM
The application of SOLID principle in PHP development includes: 1. Single responsibility principle (SRP): Each class is responsible for only one function. 2. Open and close principle (OCP): Changes are achieved through extension rather than modification. 3. Lisch's Substitution Principle (LSP): Subclasses can replace base classes without affecting program accuracy. 4. Interface isolation principle (ISP): Use fine-grained interfaces to avoid dependencies and unused methods. 5. Dependency inversion principle (DIP): High and low-level modules rely on abstraction and are implemented through dependency injection.
 Explain the concept of late static binding in PHP.
Mar 21, 2025 pm 01:33 PM
Article discusses late static binding (LSB) in PHP, introduced in PHP 5.3, allowing runtime resolution of static method calls for more flexible inheritance.Main issue: LSB vs. traditional polymorphism; LSB's practical applications and potential perfo
 How to automatically set permissions of unixsocket after system restart?
Mar 31, 2025 pm 11:54 PM
How to automatically set the permissions of unixsocket after the system restarts. Every time the system restarts, we need to execute the following command to modify the permissions of unixsocket: sudo...
 How to debug CLI mode in PHPStorm?
Apr 01, 2025 pm 02:57 PM
How to debug CLI mode in PHPStorm? When developing with PHPStorm, sometimes we need to debug PHP in command line interface (CLI) mode...
 Explain late static binding in PHP (static::).
Apr 03, 2025 am 12:04 AM
Static binding (static::) implements late static binding (LSB) in PHP, allowing calling classes to be referenced in static contexts rather than defining classes. 1) The parsing process is performed at runtime, 2) Look up the call class in the inheritance relationship, 3) It may bring performance overhead.
 How to send a POST request containing JSON data using PHP's cURL library?
Apr 01, 2025 pm 03:12 PM
Sending JSON data using PHP's cURL library In PHP development, it is often necessary to interact with external APIs. One of the common ways is to use cURL library to send POST�...


