 Web Front-end
 JS Tutorial
 How to monitor memory changes in the local environment and production environment in the Node service?
How to monitor memory changes in the local environment and production environment in the Node service?

When using Node as a server language in a production environment, excessive concurrency or code problems cause OOM (out of memory) or the CPU is fully loaded. These are common problems in servers. At this time, it is easy to find problems by monitoring CPU and memory, combined with logs and Release.
[Video tutorial recommendation: node js tutorial]
This chapter will introduce how to monitor memory changes in the local environment and production environment
A Node application instance
So, how to dynamically monitor the memory changes of a Node process?
The following is an example of a Node Server, and it is an example with a memory leak problem, and it is a streamlined version of the problem that Shanyue has been positioning in the production environment for a long time.
In that memory leak problem, the memory in a single container skyrocketed from the original 400M to 700M. Under the 800M container resource limit, OOM would occasionally occur, causing a restart. The problem was not located for a while (the problem was discovered too late, the time series data half a month ago had been swallowed up, so Release was not located), so the resource limit was raised to 1000M. Later it was found that it was caused by ctx.request mounting a large field in the database
const Koa = require('koa')
const app = new Koa()

function getData () {
  return Array.from(Array(1000)).map(x => 10086)
}

app.use(async (ctx, next) => {
  ctx.data = getData()
  await next()
})

app.use(ctx => {
  ctx.body = 'hello, world'
})

app.listen(3200, () => console.log('Port: 3200'))Process memory monitoring
Some problems need to be eliminated in time in the local and test environments , to avoid greater impact on the production environment. Then it is crucial to understand how to monitor memory locally.
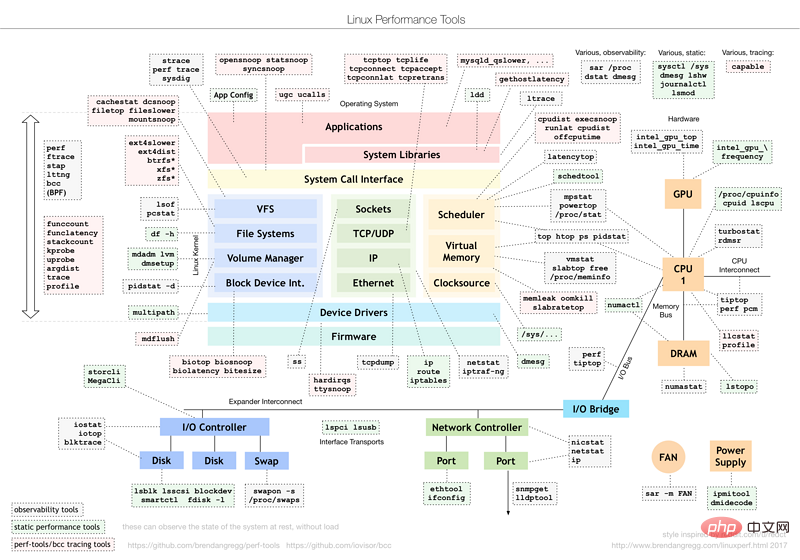
pidstat is a package of the sysstat series of Linux performance debugging tools. It is actually used to debug Linux performance problems, including memory, network, IO, CPU, etc.
This is not only tried with node, but also applies to all processes, including python, java and go
# -r: 指输出内存指标
# -p: 指定 pid
# 1: 每一秒输出一次
# 100: 输出100次
$ pidstat -r -p pid 1 100
Before using pidstat, you need to find the pid of the process pid
How to find the pid of the Node process
In node you can find the process’ pid<div class="code" style="position:relative; padding:0px; margin:0px;"><pre class='brush:php;toolbar:false;'>> process.pid
16425</pre><div class="contentsignin">Copy after login</div></div> through
although by writing The code can find pid, but is intrusive and not very practical. So how to find pid through non-invasive means? There are two ways
- Combined with redundant parameters
psLocate the process - Combined with the port number
lsofLocate the process
$ node index.js shanyue

# 第一种方法:通过多余的参数快速定位 pid
$ ps -ef | grep shanyue
root     31796 23839  1 16:38 pts/5    00:00:00 node index.js shanyue

# 第二种方法:通过端口号定位 pid
lsof -i:3200
COMMAND   PID USER   FD   TYPE    DEVICE SIZE/OFF NODE NAME
node    31796 root   20u  IPv6 235987334      0t0  TCP *:tick-port (LISTEN)
Use pidstat to monitor memory

From the above code, we can know that the pid of the node service is 31796 , in order to observe the dynamic changes of memory, apply a stress test
$ ab -c 10000 -n 1000000 http://localhost:3200/
# -r: 指输出内存指标
# -p: 指定 pid
# 1: 每一秒输出一次
# 100: 输出100次
$ pidstat -r -p 31796 1 100
Linux 3.10.0-957.21.3.el7.x86_64 (shuifeng)     2020年07月02日  _x86_64_        (2 CPU)

             UID       PID  minflt/s  majflt/s     VSZ    RSS   %MEM  Command
19时20分39秒     0     11401      0.00      0.00  566768  19800   0.12  node
19时20分40秒     0     11401      0.00      0.00  566768  19800   0.12  node
19时20分41秒     0     11401   9667.00      0.00  579024  37792   0.23  node
19时20分42秒     0     11401  11311.00      0.00  600716  59988   0.37  node
19时20分43秒     0     11401   5417.82      0.00  611420  70900   0.44  node
19时20分44秒     0     11401   3901.00      0.00  627292  85928   0.53  node
19时20分45秒     0     11401   1560.00      0.00  621660  81208   0.50  node
19时20分46秒     0     11401   2390.00      0.00  623964  83696   0.51  node
19时20分47秒 0 11401 1764.00 0.00 625500 85204 0.52 nodeThe meaning of the output indicators is as follows
- ##RSS
:Resident Set Size, resident memory set, can be understood as memory, this is the memory indicator we need to monitor - VSZ
:virtual size, virtual memory
After the stress test was applied, the memory increased from 19M to 85M.
Use top to monitor memorypidstat is a Linux performance tool under sysstat, but in mac, how to locate the memory Variety?
top/htop
$ htop -p 31796

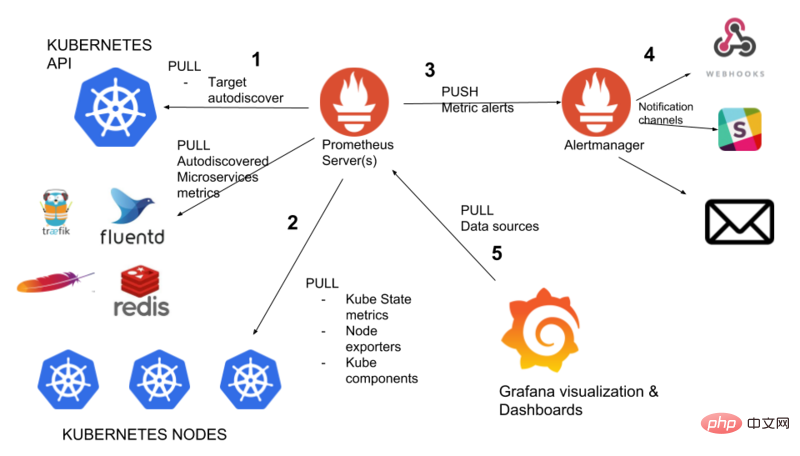
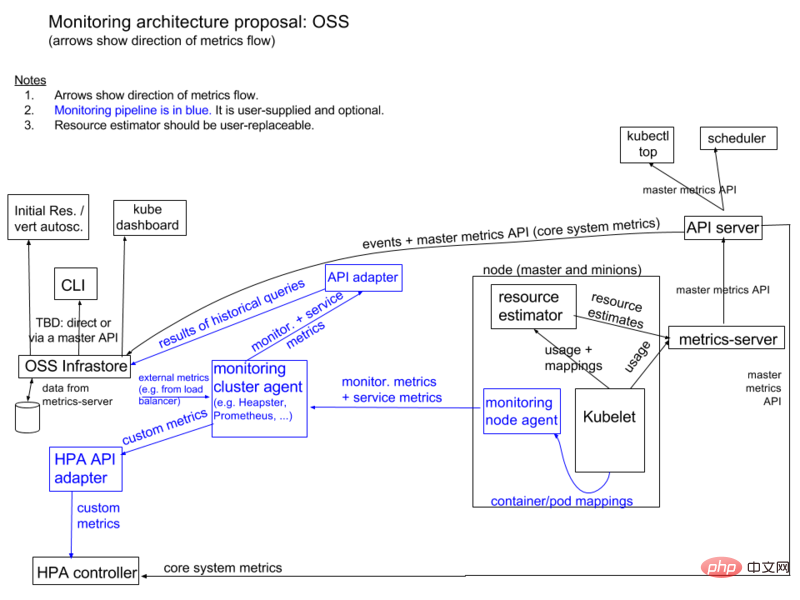
k8s, So the memory monitoring of a certain application in the production environment is essentially the memory monitoring of a certain workload/deployment by k8s, about memory monitoring# The data flow direction of ##metric is roughly as follows:
-> metric server -> prometheus -> grafanaThe architecture diagram is as follows:

 ##The above pictures are taken from the following articles
Kubernetes Monitoring with Prometheus:
Since there is too much design content in this part, I will introduce it in the following chapters
This is not only applicable to node services, but also applicable to all k8sworkload
Summary
This chapter introduces the monitoring of Node service memory in the local environment and production environment
1. Local usehtop/top or pidstat Monitor process memory
2. Use in production environmentk8s/metric-server/prometheus/grafana Monitor the memory of the entire node application
When a memory leak is detected in a certain service, how to solve the problem? Therefore, the following article will talk about
1. How the production environment monitors the memory of the entire application
2. When OOM occurs in the production environment, how to quickly locate
3. Several examples of OOM positioning in real production environments
For more programming-related knowledge, please visit:Introduction to Programming! !
The above is the detailed content of How to monitor memory changes in the local environment and production environment in the Node service?. For more information, please follow other related articles on the PHP Chinese website!

Hot AI Tools

Undresser.AI Undress
AI-powered app for creating realistic nude photos

AI Clothes Remover
Online AI tool for removing clothes from photos.

Undress AI Tool
Undress images for free

Clothoff.io
AI clothes remover

AI Hentai Generator
Generate AI Hentai for free.

Hot Article

Hot Tools

Notepad++7.3.1
Easy-to-use and free code editor

SublimeText3 Chinese version
Chinese version, very easy to use

Zend Studio 13.0.1
Powerful PHP integrated development environment

Dreamweaver CS6
Visual web development tools

SublimeText3 Mac version
God-level code editing software (SublimeText3)

Hot Topics
 1386
1386
 52
52
 How to delete node in nvm
Dec 29, 2022 am 10:07 AM
How to delete node with nvm: 1. Download "nvm-setup.zip" and install it on the C drive; 2. Configure environment variables and check the version number through the "nvm -v" command; 3. Use the "nvm install" command Install node; 4. Delete the installed node through the "nvm uninstall" command.
 How to use express to handle file upload in node project
Mar 28, 2023 pm 07:28 PM
How to handle file upload? The following article will introduce to you how to use express to handle file uploads in the node project. I hope it will be helpful to you!
 How to do Docker mirroring of Node service? Detailed explanation of extreme optimization
Oct 19, 2022 pm 07:38 PM
During this period, I was developing a HTML dynamic service that is common to all categories of Tencent documents. In order to facilitate the generation and deployment of access to various categories, and to follow the trend of cloud migration, I considered using Docker to fix service content and manage product versions in a unified manner. . This article will share the optimization experience I accumulated in the process of serving Docker for your reference.
 An in-depth analysis of Node's process management tool 'pm2”
Apr 03, 2023 pm 06:02 PM
This article will share with you Node's process management tool "pm2", and talk about why pm2 is needed, how to install and use pm2, I hope it will be helpful to everyone!
 Pi Node Teaching: What is a Pi Node? How to install and set up Pi Node?
Mar 05, 2025 pm 05:57 PM
Detailed explanation and installation guide for PiNetwork nodes This article will introduce the PiNetwork ecosystem in detail - Pi nodes, a key role in the PiNetwork ecosystem, and provide complete steps for installation and configuration. After the launch of the PiNetwork blockchain test network, Pi nodes have become an important part of many pioneers actively participating in the testing, preparing for the upcoming main network release. If you don’t know PiNetwork yet, please refer to what is Picoin? What is the price for listing? Pi usage, mining and security analysis. What is PiNetwork? The PiNetwork project started in 2019 and owns its exclusive cryptocurrency Pi Coin. The project aims to create a one that everyone can participate
 Let's talk about how to use pkg to package Node.js projects into executable files.
Dec 02, 2022 pm 09:06 PM
How to package nodejs executable file with pkg? The following article will introduce to you how to use pkg to package a Node project into an executable file. I hope it will be helpful to you!
 What to do if npm node gyp fails
Dec 29, 2022 pm 02:42 PM
npm node gyp fails because "node-gyp.js" does not match the version of "Node.js". The solution is: 1. Clear the node cache through "npm cache clean -f"; 2. Through "npm install -g n" Install the n module; 3. Install the "node v12.21.0" version through the "n v12.21.0" command.
 Token-based authentication with Angular and Node
Sep 01, 2023 pm 02:01 PM
Authentication is one of the most important parts of any web application. This tutorial discusses token-based authentication systems and how they differ from traditional login systems. By the end of this tutorial, you will see a fully working demo written in Angular and Node.js. Traditional Authentication Systems Before moving on to token-based authentication systems, let’s take a look at traditional authentication systems. The user provides their username and password in the login form and clicks Login. After making the request, authenticate the user on the backend by querying the database. If the request is valid, a session is created using the user information obtained from the database, and the session information is returned in the response header so that the session ID is stored in the browser. Provides access to applications subject to


