4 useful MySQL tuning tools recommended
This article recommends 4 mysql optimization tools. You can use them to conduct a physical examination of your mysql and generate an awr report, allowing you to grasp the overall performance of your database.

Video recommendation: MySQL video tutorial
What is the performance of running mysql? Are the parameters set appropriately? Is it clear whether there are security risks in the account settings?
As the saying goes, if you want to do your job well, you must first sharpen your tools. Regular physical examination of your MYSQL database is an important means to ensure the safe operation of the database.
Today I would like to share with you several mysql optimization tools. You can use them to conduct a physical examination of your mysql and generate an awr report, allowing you to grasp the overall performance of your database.

1. mysqltuner-pl
This is a commonly used database performance diagnostic tool for mysql. It mainly checks the rationality of parameter settings. Includes log files, storage engines, security recommendations and performance analysis. It is a good helper for mysql optimization to provide suggestions for improvement based on potential problems.
In the previous version, MySQLTuner supported about 300 metrics for MySQL/MariaDB/Percona Server.
Project address: https://github.com/major/MySQ...
1.1 Download
[root@localhost ~]#wget https://raw.githubusercontent.com/major/MySQLTuner-perl/master/mysqltuner.pl
1.2 Use
[root@localhost ~]# ./mysqltuner.pl --socket /var/lib/mysql/mysql.sock >> MySQLTuner 1.7.4 - Major Hayden <major> >> Bug reports, feature requests, and downloads at http://mysqltuner.com/ >> Run with '--help' for additional options and output filtering\[--\] Skipped version check for MySQLTuner scriptPlease enter your MySQL administrative login: rootPlease enter your MySQL administrative password: \[OK\] Currently running supported MySQL version 5.7.23\[OK\] Operating on 64-bit architecture</major>
1.3. Report analysis
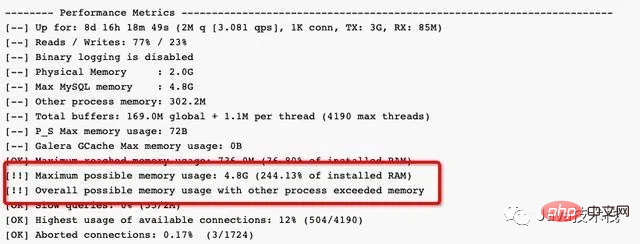
1) Important attention [!!] (items with exclamation marks in square brackets) such as [!!] Maximum possible memory usage : 4.8G (244.13% of installed RAM), indicating that the memory has been seriously exceeded.

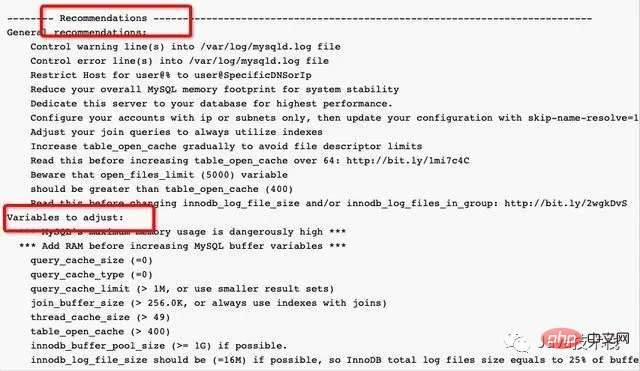
#2) Pay attention to the last suggestions “Recommendations”.

2. tuning-primer.sh
This is another optimization tool for mysql, which is used to perform an optimization on mysql as a whole. Physical examination and optimization suggestions for potential problems.
Project address: https://github.com/BMDan/tuni...
Currently, the content that supports detection and optimization suggestions is as follows:

2.1 Download
[root@localhost ~]#wget https://launchpad.net/mysql-tuning-primer/trunk/1.6-r1/+download/tuning-primer.sh
2.2 Use
[root@localhost ~]#  [root@localhost dba]#  ./tuning-primer.sh

-- MYSQL PERFORMANCE TUNING PRIMER --
- By: Matthew Montgomery -
2.3 Report analysis
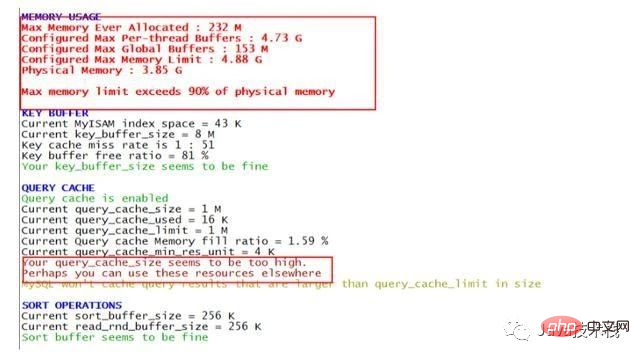
Focus on the options with red alerts and modify them according to the suggestions and the actual situation of your own system, for example:

3, pt-variable-advisor
pt-variable-advisor can analyze MySQL variables and make recommendations on possible problems.
3.1 Installation
https://www.percona.com/downl...
[root@localhost ~]#wget https://www.percona.com/downloads/percona-toolkit/3.0.13/binary/redhat/7/x86\_64/percona-toolkit-3.0.13-re85ce15-el7-x86\_64-bundle.tar\[root@localhost ~\]#yum install percona-toolkit-3.0.13-1.el7.x86_64.rpm
3.2 Use
pt-variable-advisor is a sub-tool of the pt tool set, mainly used to diagnose whether your parameter settings are reasonable.
[root@localhost ~]# pt-variable-advisor localhost --socket /var/lib/mysql/mysql.sock
3.3 Report analysis
Focus on entries with WARN information, for example:
4. pt-qurey-digest
pt-query-digest’s main function is to analyze MySQL queries from logs, process lists and tcpdump.
4.1Installation
For details, please refer to Section 3.1
4.2Using
pt-query-digest Main Used to analyze mysql's slow logs. Compared with the mysqldumpshow tool, the analysis results of the py-query_digest tool are more specific and complete.
[root@localhost ~]# pt-query-digest /var/lib/mysql/slowtest-slow.log
4.3 Common usage analysis
1) Directly analyze slow query files:
pt-query-digest /var/lib/mysql/slowtest-slow.log > slow_report.log
2) Analyze queries within the last 12 hours:
pt-query-digest --since=12h /var/lib/mysql/slowtest-slow.log > slow_report2.log
3) Analyze queries within the specified time range:
pt-query-digest /var/lib/mysql/slowtest-slow.log --since '2017-01-07 09:30:00' --until '2017-01-07 10:00:00'> > slow_report3.log
4) Analyze slow queries that contain select statements
pt-query-digest --filter '$event->{fingerprint} =~ m/^select/i' /var/lib/mysql/slowtest-slow.log> slow_report4.log5) Slow queries for a certain user
pt-query-digest --filter '($event->{user} || "") =~ m/^root/i' /var/lib/mysql/slowtest-slow.log> slow_report5.log6) Query all slow queries of full table scan or full join
pt-query-digest --filter '(($event->{Full\_scan} || "") eq "yes") ||(($event->{Full\_join} || "") eq "yes")' /var/lib/mysql/slowtest-slow.log> slow_report6.log4.4 Report analysis
Part 1: Overall statistical results
Overall: How many queries are there in total? Time range: The time range of query execution unique: The number of unique queries, that is, after parameterizing the query conditions, how many different queries are there in total? Total: Total min: Minimum max: Maximum avg: average 95%: arrange all values from small to large, the number located in the 95th percentile, this number generally has the most reference value median: median, arrange all values from small to large, the number located in the middle
Part 2: Query group statistical results
Rank: Ranking of all statements, sorted by query time in descending order by default, specify Query ID through --order-by: ID of the statement, (remove excess spaces and text characters, calculate hash value) Response: total response time time : The total time proportion of this query in this analysis calls: The number of executions, that is, the total number of query statements of this type in this analysis R/Call: The average response time of each execution V/M: Response time Variance -to-mean ratio Item: Query object
Part 3: Detailed statistical results of each query
ID: Query ID number, corresponding to the Query ID in the above figure Databases: Database name Users: the number of executions by each user (proportion) Query_time distribution: query time distribution, the length reflects the interval proportion. Tables: Tables involved in the query Explain: SQL statement.
Life is wonderful, see you tomorrow~
For more programming-related knowledge, please visit: Introduction to Programming! !
The above is the detailed content of 4 useful MySQL tuning tools recommended. For more information, please follow other related articles on the PHP Chinese website!

Hot AI Tools

Undresser.AI Undress
AI-powered app for creating realistic nude photos

AI Clothes Remover
Online AI tool for removing clothes from photos.

Undress AI Tool
Undress images for free

Clothoff.io
AI clothes remover

AI Hentai Generator
Generate AI Hentai for free.

Hot Article

Hot Tools

Notepad++7.3.1
Easy-to-use and free code editor

SublimeText3 Chinese version
Chinese version, very easy to use

Zend Studio 13.0.1
Powerful PHP integrated development environment

Dreamweaver CS6
Visual web development tools

SublimeText3 Mac version
God-level code editing software (SublimeText3)

Hot Topics
 1378
1378
 52
52
 MySQL: Simple Concepts for Easy Learning
Apr 10, 2025 am 09:29 AM
MySQL is an open source relational database management system. 1) Create database and tables: Use the CREATEDATABASE and CREATETABLE commands. 2) Basic operations: INSERT, UPDATE, DELETE and SELECT. 3) Advanced operations: JOIN, subquery and transaction processing. 4) Debugging skills: Check syntax, data type and permissions. 5) Optimization suggestions: Use indexes, avoid SELECT* and use transactions.
 How to open phpmyadmin
Apr 10, 2025 pm 10:51 PM
You can open phpMyAdmin through the following steps: 1. Log in to the website control panel; 2. Find and click the phpMyAdmin icon; 3. Enter MySQL credentials; 4. Click "Login".
 How to create navicat premium
Apr 09, 2025 am 07:09 AM
Create a database using Navicat Premium: Connect to the database server and enter the connection parameters. Right-click on the server and select Create Database. Enter the name of the new database and the specified character set and collation. Connect to the new database and create the table in the Object Browser. Right-click on the table and select Insert Data to insert the data.
 MySQL and SQL: Essential Skills for Developers
Apr 10, 2025 am 09:30 AM
MySQL and SQL are essential skills for developers. 1.MySQL is an open source relational database management system, and SQL is the standard language used to manage and operate databases. 2.MySQL supports multiple storage engines through efficient data storage and retrieval functions, and SQL completes complex data operations through simple statements. 3. Examples of usage include basic queries and advanced queries, such as filtering and sorting by condition. 4. Common errors include syntax errors and performance issues, which can be optimized by checking SQL statements and using EXPLAIN commands. 5. Performance optimization techniques include using indexes, avoiding full table scanning, optimizing JOIN operations and improving code readability.
 How to create a new connection to mysql in navicat
Apr 09, 2025 am 07:21 AM
You can create a new MySQL connection in Navicat by following the steps: Open the application and select New Connection (Ctrl N). Select "MySQL" as the connection type. Enter the hostname/IP address, port, username, and password. (Optional) Configure advanced options. Save the connection and enter the connection name.
 How to recover data after SQL deletes rows
Apr 09, 2025 pm 12:21 PM
Recovering deleted rows directly from the database is usually impossible unless there is a backup or transaction rollback mechanism. Key point: Transaction rollback: Execute ROLLBACK before the transaction is committed to recover data. Backup: Regular backup of the database can be used to quickly restore data. Database snapshot: You can create a read-only copy of the database and restore the data after the data is deleted accidentally. Use DELETE statement with caution: Check the conditions carefully to avoid accidentally deleting data. Use the WHERE clause: explicitly specify the data to be deleted. Use the test environment: Test before performing a DELETE operation.
 How to use single threaded redis
Apr 10, 2025 pm 07:12 PM
Redis uses a single threaded architecture to provide high performance, simplicity, and consistency. It utilizes I/O multiplexing, event loops, non-blocking I/O, and shared memory to improve concurrency, but with limitations of concurrency limitations, single point of failure, and unsuitable for write-intensive workloads.
 MySQL: An Introduction to the World's Most Popular Database
Apr 12, 2025 am 12:18 AM
MySQL is an open source relational database management system, mainly used to store and retrieve data quickly and reliably. Its working principle includes client requests, query resolution, execution of queries and return results. Examples of usage include creating tables, inserting and querying data, and advanced features such as JOIN operations. Common errors involve SQL syntax, data types, and permissions, and optimization suggestions include the use of indexes, optimized queries, and partitioning of tables.


