
 Web Front-end
JS Tutorial
Avoid log pollution of application logs using the Node.js 'debug” module
Web Front-end
JS Tutorial
Avoid log pollution of application logs using the Node.js 'debug” module
Avoid log pollution of application logs using the Node.js 'debug” module

This article will introduce you to how to use the Node.js "debug" module to avoid log pollution of application logs. It has certain reference value. Friends in need can refer to it. I hope it will be helpful to everyone.

Video tutorial recommendation: nodejs tutorial
Have you ever had such an experience, please record it into a custom Node module, thinking you would benefit from the extra information, only to find that when you add the module as a dependency and run npm install and npm start , will your program log look like the following?

#How do you find the information you actually need? Like who logged in and when, rather than information from application dependencies:
Likewise, when you suspect that your When a change the team made to a Node module dependency caused performance degradation, the only logs that needed to be addressed were:

Looking at the big picture, this is Here’s what log pollution looks like:
What do we want
The ideal logging solution is one where module logs do not enter the logging of a program or service, but Ability to open it for troubleshooting when needed.
To do this, I will show you how to use the debug module to turn logging on or off in the Node module.
If you don't need them and the service using this module runs fine, set it to OFF.
ON Used when you encounter a problem and need as much log information as possible.
debug Module Overview
In terms of functionality, please do not think of debug modules as you would normally think of them in a debugger (like how you set breakpoints in the IDE) in the same way), but should be more like a modified console module. This is a tool that allows you to turn logs on and off as needed. If you go to its GitHub page (https://github.com/visionmedi...), you will also see its various other features, such as namespaces, etc. Ignore that for now, just know that it is a tool that can optimize your production environment.
Implementing debug in your own Node module
Let’s look at an example of using debug in your code. Assume the following is a module:
const debug = require('debug');
const log = debug('http:server');
const http = require('http');
const name = 'Demo App for debug module';

log('booting %o', name);

http.createServer((req, res) => {
  log(req.method + ' ' + req.url);
  res.end('debug example\n');
}).listen(3200, () => {
  log('listening');
});Implementing debug is easy. All we have to do is import or require the module, and then create a logger - const log = debug('http:server'); . You just need to pass the tag or namespace 'http:server' of a specific logger to the DEBUG environment variable to enable debugging.
When you start the application (that is, the program that imported the module), you will start it like this:
DEBUG=http:server node app-entrypoint.js
If we want What should I do if I use a separate logger to switch certain logs? For example, what if we only want to switch to error? It's as simple as creating another logger, like this:
const debug = require('debug');
const log = debug('http:server');
const errorLogger = debug('http:error'); // create new logger here, passing it a new namespace
const http = require('http');
const name = 'Demo App for debug module';

log('booting %o', name);

http.createServer((req, res) => {
  log(req.method + ' ' + req.url);
  res.end('hello\n');

  // fake an error to demonstrate using debug for http:error namespace
  setTimeout(() => {
    errorLogger('fake error'); // then call the logger
  }, 1000);
}).listen(3200, () => {
  log('listening');
});The following will only open errors:
#
DEBUG=http:error node app-entrypoint.js
而且,当你要记录所有命名空间的日志时(在这种情况下,是 http:server 和 http:error),只需传递通配符 * 即可。
DEBUG=http:* node app-entrypoint.js
让我们看看这些日志现在是什么样的:
然后,当我们加载页面时:
注意,debug 会写入 stderr 而不是 stdout,所以如果你有一个根据不同的来源提取日志的日志路由,这些调试日志将最终会存储在 stderr 流中。
最后,你还可以选择:
- 你可以记录所有用
debug编写的模块的日志。 - 或者,你仍然可以用
console.log()/console.error()记录某些内容,而另一些记录debug
如果你有必须要记录的事项,并且与使用该模块的应用程序有关,请用 console 将其记录下来。但是如果你不这样做,就会用 debug 记录所有的内容。
为第三方模块打开 debug
到目前为止,如果你(或你的团队)编写了该模块,那么我们所介绍的内容就很棒。
但是如果你用的是第三方模块,那需要打开调试时该怎么办?
也许你已经对程序的各个部分进行了故障排除,不够现在假设你正在使用的开源模块可能会让你遇到问题。
好消息是,debug 是一个使用非常广泛的模块,npm 中的许多模块可能都在用它。第三方模块的创建者知道(至少,应该知道)该模块的用户真的不希望默认情况下进行记录,因为所有其他的日志都可能会变得杂乱无章。
由于 Express 内部使用了 debug 模块,所以如果你用了 Express 并需要对其进行故障排除,则可以通过运行以下命令打开日志:
DEBUG=express:* node your-app-entrypoint.js
查看开源 node 模块是否使用了 debug 以及是如何使用的
如果在文档中没有看到关于是否使用了 debug 的内容该怎么办? 即便如此,也有可能使用了该模块,但是你必须进行一些挖掘。
我们已经知道 Express 文档中描述了该如何使用它,但是我们假设它并没有记录在案:
首先,你可以在项目的 GitHub(或其他开放源代码网站)上搜索 package.json,然后查找其中列出的作为依赖项的模块:
确认后,你还需要确认 1)实际正在使用中,以及 2)切换需要使用哪些标志。 GitHub 现在具有一项不错的功能,你可以在其中使用搜索栏搜索项目本身。如果我们在 Express 项目中搜索“debug”,则会发现以下内容:
我们可以看到切换标记为 “express”,因此 express:* 将为我们提供所有的日志,express:view 将为我们提供视图的日志,等等。
总结
希望你看到在 node 模块中实现 debug 并为第三方模块打开它是多么容易,以及它可以怎样帮你清理日志,同时又为你提供了一种方便的方法来将其重新打开进行故障排除。
英文原文地址:https://www.coreycleary.me/using-the-debug-module-to-avoid-polluting-your-application-logs-with-logs-from-node-modules/
作者:Corey Cleary
更多编程相关知识,可访问:编程入门!!
The above is the detailed content of Avoid log pollution of application logs using the Node.js 'debug” module. For more information, please follow other related articles on the PHP Chinese website!

Hot AI Tools

Undresser.AI Undress
AI-powered app for creating realistic nude photos

AI Clothes Remover
Online AI tool for removing clothes from photos.

Undress AI Tool
Undress images for free

Clothoff.io
AI clothes remover

AI Hentai Generator
Generate AI Hentai for free.

Hot Article
Hot Tools

Notepad++7.3.1
Easy-to-use and free code editor

SublimeText3 Chinese version
Chinese version, very easy to use

Zend Studio 13.0.1
Powerful PHP integrated development environment

Dreamweaver CS6
Visual web development tools

SublimeText3 Mac version
God-level code editing software (SublimeText3)
Hot Topics
 1382
1382
 52
52

![WLAN expansion module has stopped [fix]](https://img.php.cn/upload/article/000/465/014/170832352052603.gif?x-oss-process=image/resize,m_fill,h_207,w_330) WLAN expansion module has stopped [fix]
Feb 19, 2024 pm 02:18 PM
WLAN expansion module has stopped [fix]
Feb 19, 2024 pm 02:18 PM
If there is a problem with the WLAN expansion module on your Windows computer, it may cause you to be disconnected from the Internet. This situation is often frustrating, but fortunately, this article provides some simple suggestions that can help you solve this problem and get your wireless connection working properly again. Fix WLAN Extensibility Module Has Stopped If the WLAN Extensibility Module has stopped working on your Windows computer, follow these suggestions to fix it: Run the Network and Internet Troubleshooter to disable and re-enable wireless network connections Restart the WLAN Autoconfiguration Service Modify Power Options Modify Advanced Power Settings Reinstall Network Adapter Driver Run Some Network Commands Now, let’s look at it in detail
 What is event ID 6013 in win10?
Jan 09, 2024 am 10:09 AM
What is event ID 6013 in win10?
Jan 09, 2024 am 10:09 AM
The logs of win10 can help users understand the system usage in detail. Many users must have encountered log 6013 when looking for their own management logs. So what does this code mean? Let’s introduce it below. What is win10 log 6013: 1. This is a normal log. The information in this log does not mean that your computer has been restarted, but it indicates how long the system has been running since the last startup. This log will appear once every day at 12 o'clock sharp. How to check how long the system has been running? You can enter systeminfo in cmd. There is one line in it.
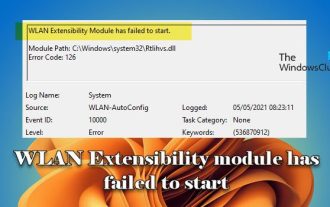 WLAN extensibility module cannot start
Feb 19, 2024 pm 05:09 PM
WLAN extensibility module cannot start
Feb 19, 2024 pm 05:09 PM
This article details methods to resolve event ID10000, which indicates that the Wireless LAN expansion module cannot start. This error may appear in the event log of Windows 11/10 PC. The WLAN extensibility module is a component of Windows that allows independent hardware vendors (IHVs) and independent software vendors (ISVs) to provide users with customized wireless network features and functionality. It extends the capabilities of native Windows network components by adding Windows default functionality. The WLAN extensibility module is started as part of initialization when the operating system loads network components. If the Wireless LAN Expansion Module encounters a problem and cannot start, you may see an error message in the event viewer log.
 Troubleshooting Event 7034 Error Log Issues in Win10
Jan 11, 2024 pm 02:06 PM
Troubleshooting Event 7034 Error Log Issues in Win10
Jan 11, 2024 pm 02:06 PM
The logs of win10 can help users understand the system usage in detail. Many users must have seen a lot of error logs when looking for their own management logs. So how to solve them? Let’s take a look below. . How to solve win10 log event 7034: 1. Click "Start" to open "Control Panel" 2. Find "Administrative Tools" 3. Click "Services" 4. Find HDZBCommServiceForV2.0, right-click "Stop Service" and change it to "Manual Start "
 How to view your medication log history in the Health app on iPhone
Nov 29, 2023 pm 08:46 PM
How to view your medication log history in the Health app on iPhone
Nov 29, 2023 pm 08:46 PM
iPhone lets you add medications to the Health app to track and manage the medications, vitamins and supplements you take every day. You can then log medications you've taken or skipped when you receive a notification on your device. After you log your medications, you can see how often you took or skipped them to help you track your health. In this post, we will guide you to view the log history of selected medications in the Health app on iPhone. A short guide on how to view your medication log history in the Health App: Go to the Health App>Browse>Medications>Medications>Select a Medication>Options&a
 Detailed explanation of log viewing command in Linux system!
Mar 06, 2024 pm 03:55 PM
Detailed explanation of log viewing command in Linux system!
Mar 06, 2024 pm 03:55 PM
In Linux systems, you can use the following command to view the contents of the log file: tail command: The tail command is used to display the content at the end of the log file. It is a common command to view the latest log information. tail [option] [file name] Commonly used options include: -n: Specify the number of lines to be displayed, the default is 10 lines. -f: Monitor the file content in real time and automatically display the new content when the file is updated. Example: tail-n20logfile.txt#Display the last 20 lines of the logfile.txt file tail-flogfile.txt#Monitor the updated content of the logfile.txt file in real time head command: The head command is used to display the beginning of the log file
 Detailed explanation of how Ansible works
Feb 18, 2024 pm 05:40 PM
Detailed explanation of how Ansible works
Feb 18, 2024 pm 05:40 PM
The working principle of Ansible can be understood from the above figure: the management end supports three methods of local, ssh, and zeromq to connect to the managed end. The default is to use the ssh-based connection. This part corresponds to the connection module in the above architecture diagram; you can press the application type HostInventory (host list) classification is carried out in other ways. The management node implements corresponding operations through various modules. A single module and batch execution of a single command can be called ad-hoc; the management node can implement a collection of multiple tasks through playbooks. Implement a type of functions, such as installation and deployment of web services, batch backup of database servers, etc. We can simply understand playbooks as, the system passes
 This article summarizes the classic methods and effect comparison of feature enhancement & personalization in CTR estimation.
Dec 15, 2023 am 09:23 AM
This article summarizes the classic methods and effect comparison of feature enhancement & personalization in CTR estimation.
Dec 15, 2023 am 09:23 AM
In CTR estimation, the mainstream method uses feature embedding+MLP, in which features are very critical. However, for the same features, the representation is the same in different samples. This way of inputting to the downstream model will limit the expressive ability of the model. In order to solve this problem, a series of related work has been proposed in the field of CTR estimation, which is called feature enhancement module. The feature enhancement module corrects the output results of the embedding layer based on different samples to adapt to the feature representation of different samples and improve the expression ability of the model. Recently, Fudan University and Microsoft Research Asia jointly published a review on feature enhancement work, comparing the implementation methods and effects of different feature enhancement modules. Now, let us introduce a
