How to use Echarts to generate statistical reports in PHP

藏色散人
Release: 2023-04-09 15:38:02
forward
6737 people have browsed it

echarts statistics, simple example

Recommended: "PHP Video Tutorial"

Look at the renderings first
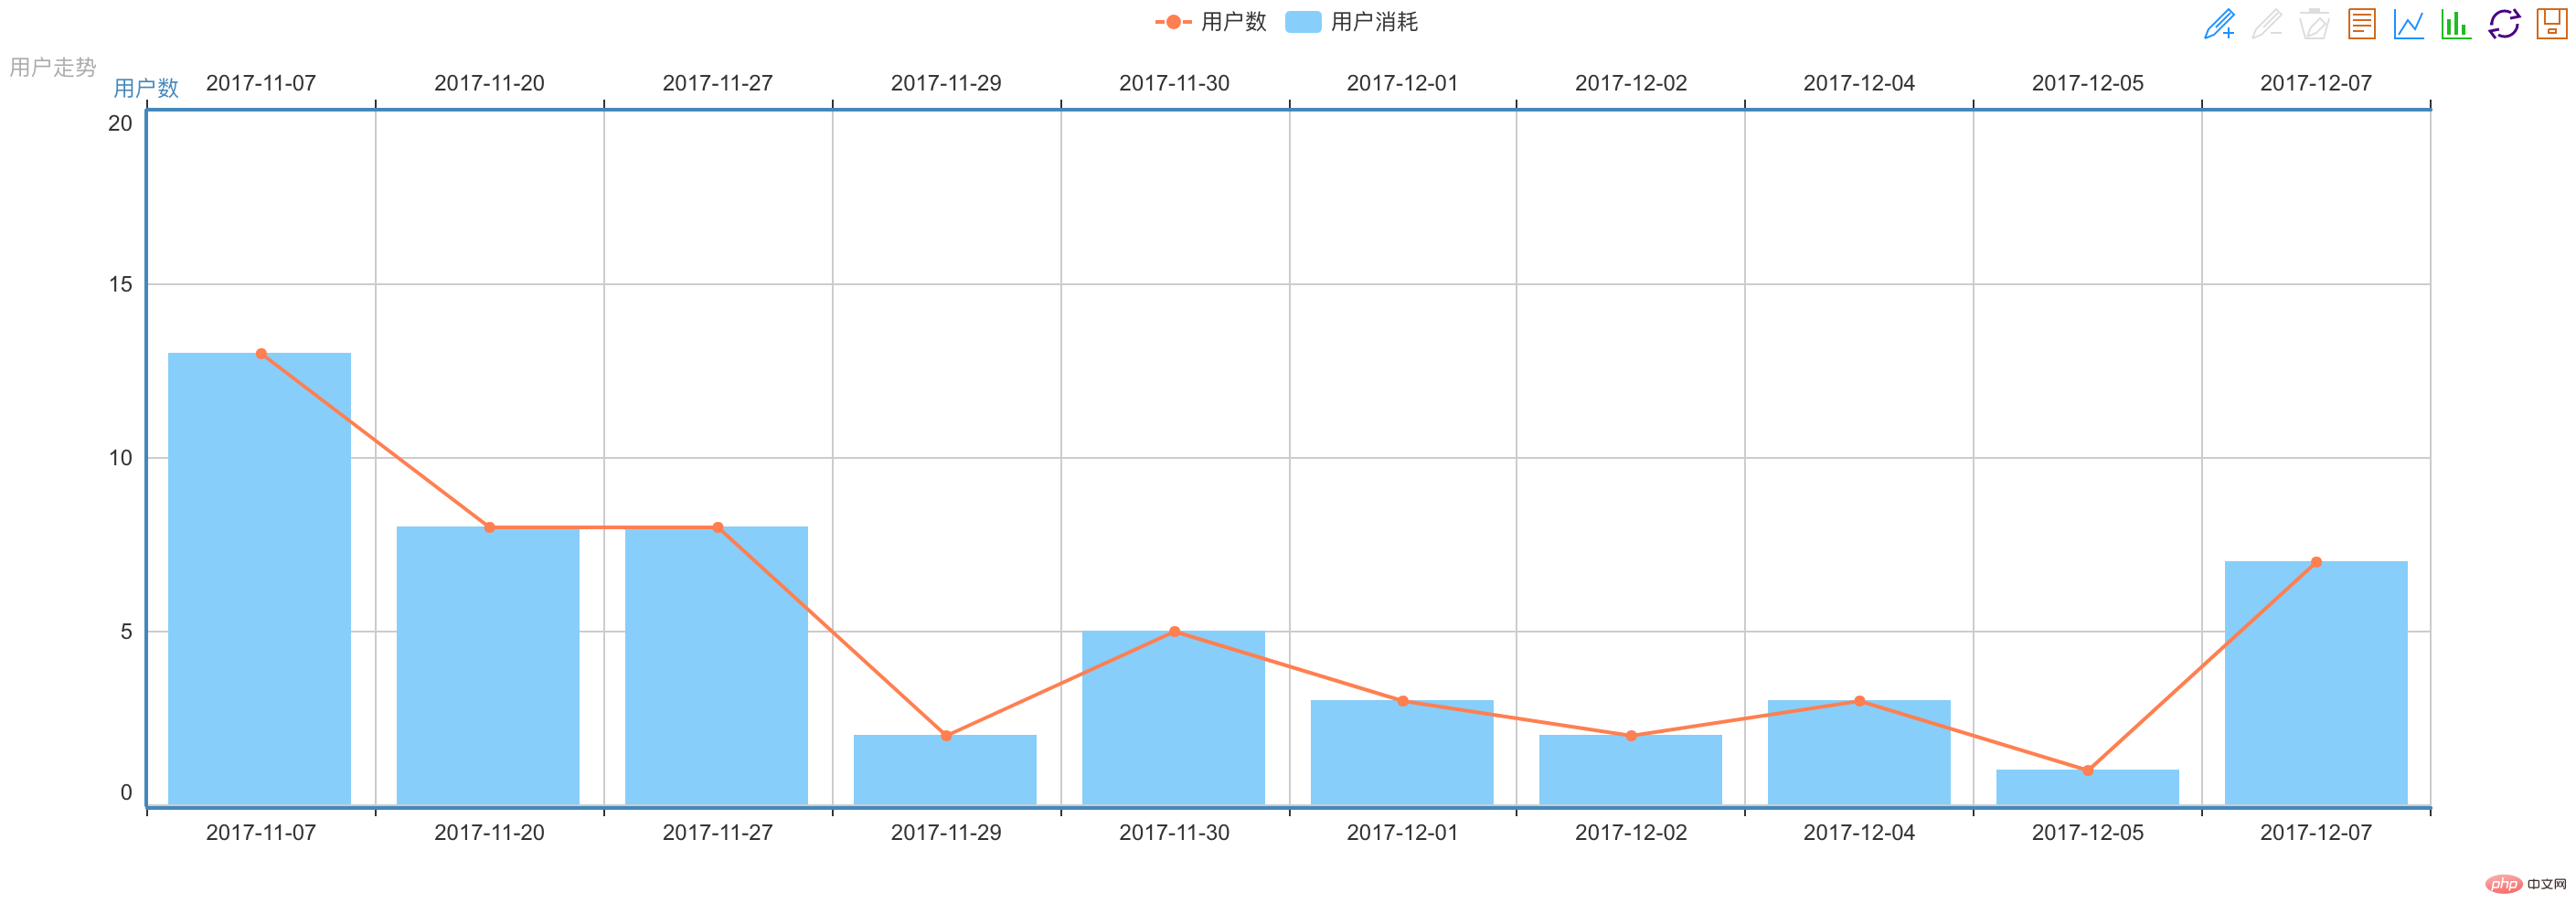
Look at the code

HTML page Prepare a Dom for ECharts, customize the width and height

<div class="panel panel-info">
  <div class="panel-body">
    <div id="echart_show" style="height:500px"></div>
  </div>
</div>
Copy after login

js file can refer to the official website, or download it here and introduce

<script type="text/javascript" src="__ROOT__/Public/admin/lib/jquery/nowdatachars/echarts-all.js"></script>
Copy after login

The following is the specific method

<script type="text/javascript">

    var date = [],num = [];
    $(document).ready(function () {
        // 绘制反馈量图形
        var init_echarts = function () {
            var refreshChart = function (show_data) {
                my_demo_chart = echarts.init(document.getElementById(&#39;echart_show&#39;));

                my_demo_chart.showLoading({
                    text: &#39;加载中...&#39;,
                    effect: &#39;whirling&#39;
                });

                var echarts_all_option = {
                    title: {
                        text: &#39;&#39;,
                        subtext: &#39;用户走势&#39;
                    },
                    tooltip: {
                        trigger: &#39;axis&#39;
                    },
                    legend: {
                        data: [&#39;用户数&#39;, &#39;用户消耗&#39;]
                    },
                    toolbox: {
                        show: true,
                        feature: {
                            mark: {show: true},
                            dataView: {show: true, readOnly: false},
                            magicType: {show: true, type: [&#39;line&#39;, &#39;bar&#39;]},
                            restore: {show: true},
                            saveAsImage: {show: true}
//                            myTool2: {
//                                show: true,
//                                title: &#39;自定义扩展方法&#39;,
//                                icon: &#39;image://http://echarts.baidu.com/images/favicon.png&#39;,
//                                onclick: function (){
//                                    alert(&#39;自定义&#39;)
//                                }
//                            }
                        }
                    },
                    dataZoom: {
                        show: false,
                        start: 0,
                        end: 100
                    },
                    xAxis: [
                        {
                            type: &#39;category&#39;,
                            boundaryGap: true,
                            data: show_data[1]
                        },
                        {
                            type: &#39;category&#39;,
                            boundaryGap: true,
                            data: show_data[1]
                        }
                    ],
                    yAxis: [
                        {
                            type: &#39;value&#39;,
                            scale: true,
                            name: &#39;用户数&#39;,
                            boundaryGap: [0, 0.5]
//                            boundaryGap: [0.2, 0.2]
                        },
                        {
                            type: &#39;value&#39;,
                            scale: true,
                            name: &#39;用户数&#39;,
                            boundaryGap: [0, 0.5]
                        }
                    ],
                    series: [
                        {
                            name: &#39;用户消耗&#39;,
                            type: &#39;bar&#39;,
                            xAxisIndex: 1,
                            data: show_data[0]
                        },
                        {
                            name: &#39;用户数&#39;,
                            type: &#39;line&#39;,
                            xAxisIndex: 1,
                            data:show_data[0]
                        }
                    ]
                };
                my_demo_chart.hideLoading();
                my_demo_chart.setOption(echarts_all_option);
            };

            // 获取原始数据
            $.ajax({
                url:"__CONTROLLER__/getRes",
                async:false,
                dataType:&#39;json&#39;,
                type:&#39;post&#39;,

                success:function(msg){
                    var result = msg.result;
                    if(msg.code == 200){
                        for(var i = 0 ; i < result.length; i++){
                            date.push(result[i].date);
                            num.push(result[i].count);
                            msg[0] = num;
                            msg[1] = date;
                            refreshChart(msg);
                        }
                    }
                }
            });
        };

        // 默认加载
        var default_load = (function () {
            init_echarts();
        })();
    });


</script>
Copy after login

Query the data you need in the controller (the date queried here and the corresponding quantity)

//折线统计
    public function getRes(){
        $user = M(&#39;account&#39;);
        $sql = "SELECT date(createTime) AS date,count(*) as count FROM t_account  GROUP BY date ";
        $result = $user->query($sql);
        $this->ajaxReturn(array(&#39;code&#39;=>200,&#39;result&#39;=>$result));
    }
Copy after login

At this point, a simple echarts statistical chart comes out

If you don’t understand some parameters in echarts, you can refer to the official website https://www.echartsjs.com/option.html#title

The above is the detailed content of How to use Echarts to generate statistical reports in PHP. For more information, please follow other related articles on the PHP Chinese website!

Related labels:
source:cnblogs.com
Statement of this Website
The content of this article is voluntarily contributed by netizens, and the copyright belongs to the original author. This site does not assume corresponding legal responsibility. If you find any content suspected of plagiarism or infringement, please contact admin@php.cn
Popular Tutorials
More>
Latest Downloads
More>
Web Effects
Website Source Code
Website Materials
Front End Template
About us Disclaimer Sitemap
php.cn:Public welfare online PHP training,Help PHP learners grow quickly!