16 DevTools tips you need to know in CSS development

Most developers basically use the browser's developer tools to debug the front end, but even after using Chrome's developer tools for several years, I still encounter things I have never seen before. Tips and features.
In this article, I wrote about many CSS-related features and techniques in developer tools that I think will take your CSS development to the next level. Some of these tips aren't specific to CSS, but I've put them together anyway.
Some are simple tips on workflow and debugging, while others are new features introduced in recent years. Most of them are based on Chrome's developer tools, but also cover some Firefox tips.
Inspecting the CSS of elements displayed via JavaScript
It’s not difficult to find the CSS for most elements in the Elements panel of the Developer Tools. In most cases you just need to right-click the element, click Inspect, and then (if necessary) double-click to find it in the Elements panel. Once an element is selected, its CSS appears in the Styles panel, ready for editing.
Sometimes an element will be displayed dynamically due to some JavaScript-based user operations, such as click or mouseover. The most intuitive way to review them is to temporarily change your JavaScript or CSS to make them visible by default, allowing you to handle it without having to imitate user actions.
But if you are looking for a faster way to make elements visible using only the developer tools, you can follow these steps:
1. Open the developer tools
2 , Open the Sources panel
3. Perform user operations to make the object visible (such as mouse hover)
4. Press F8 when the element is visible (same as the "Pause Script Execution" button)
5. Click the "Select Element" button in the upper left corner of the developer tools
6. Click on the element on the page
We can use Bootstrap's tooltips Test, it will only be displayed when hovering the mouse over the link to trigger JavaScript. Here is a demonstration:
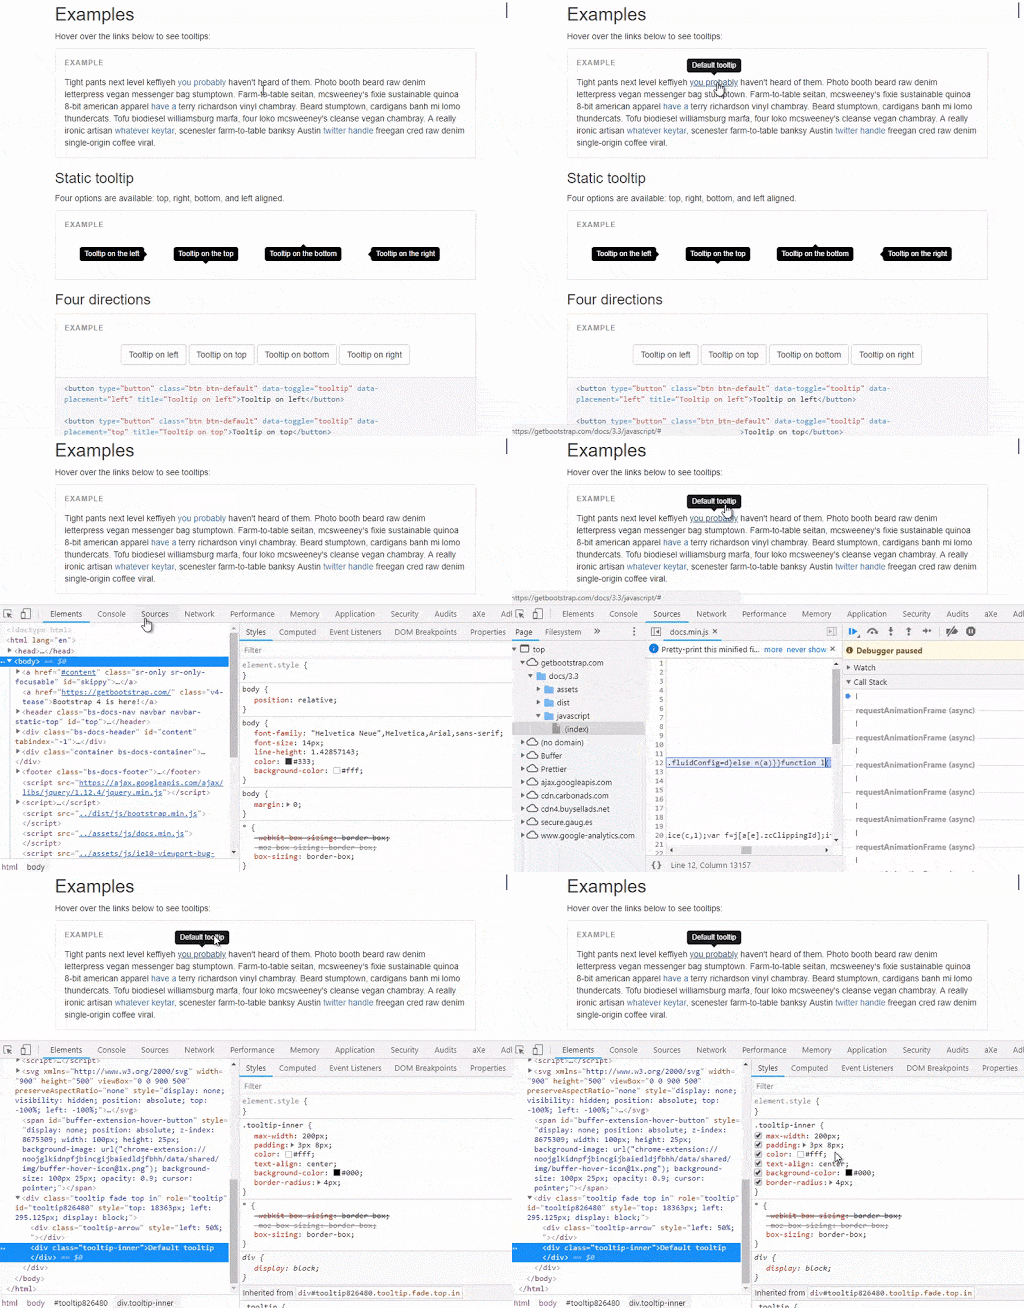
As you can see at the beginning of the GIF, I cannot select the element at first Come review it because it disappears once the mouse is moved away. But if I stop the script from running while it's visible, it stays visible so I can inspect it properly. Of course, if the element is just a simple CSS :hover effect, then I can use the Styles panel's "Toggle Element State" (:hov button) to toggle the state to make it appear. But in the case of styles switched by JavaScript, stopping the script may be the best way to get their CSS styles.
Searching for elements via CSS selectors
You may know that you can search for an element in the Elements panel using built-in functionality (CTRL F or CMD F). But pay attention to the "find" column, it will give you the following prompt:
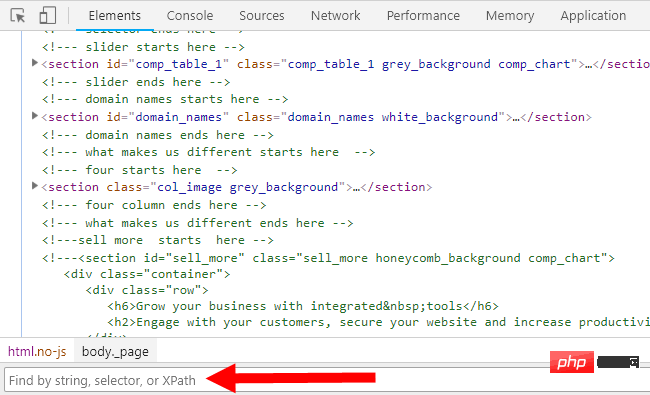
As I pointed out in the screenshot, you can find by string, selector and XPath element. I've always been using strings and it wasn't until recently that I realized I could use selectors.
You don’t have to use the selector used in your CSS, it can be any legal CSS selector. The find function will tell you if the selector matches any element. This is useful for finding elements and also for testing whether a selector is valid.
The following is a demo that uses the body > div selector to search and traverse all direct child div elements of body:
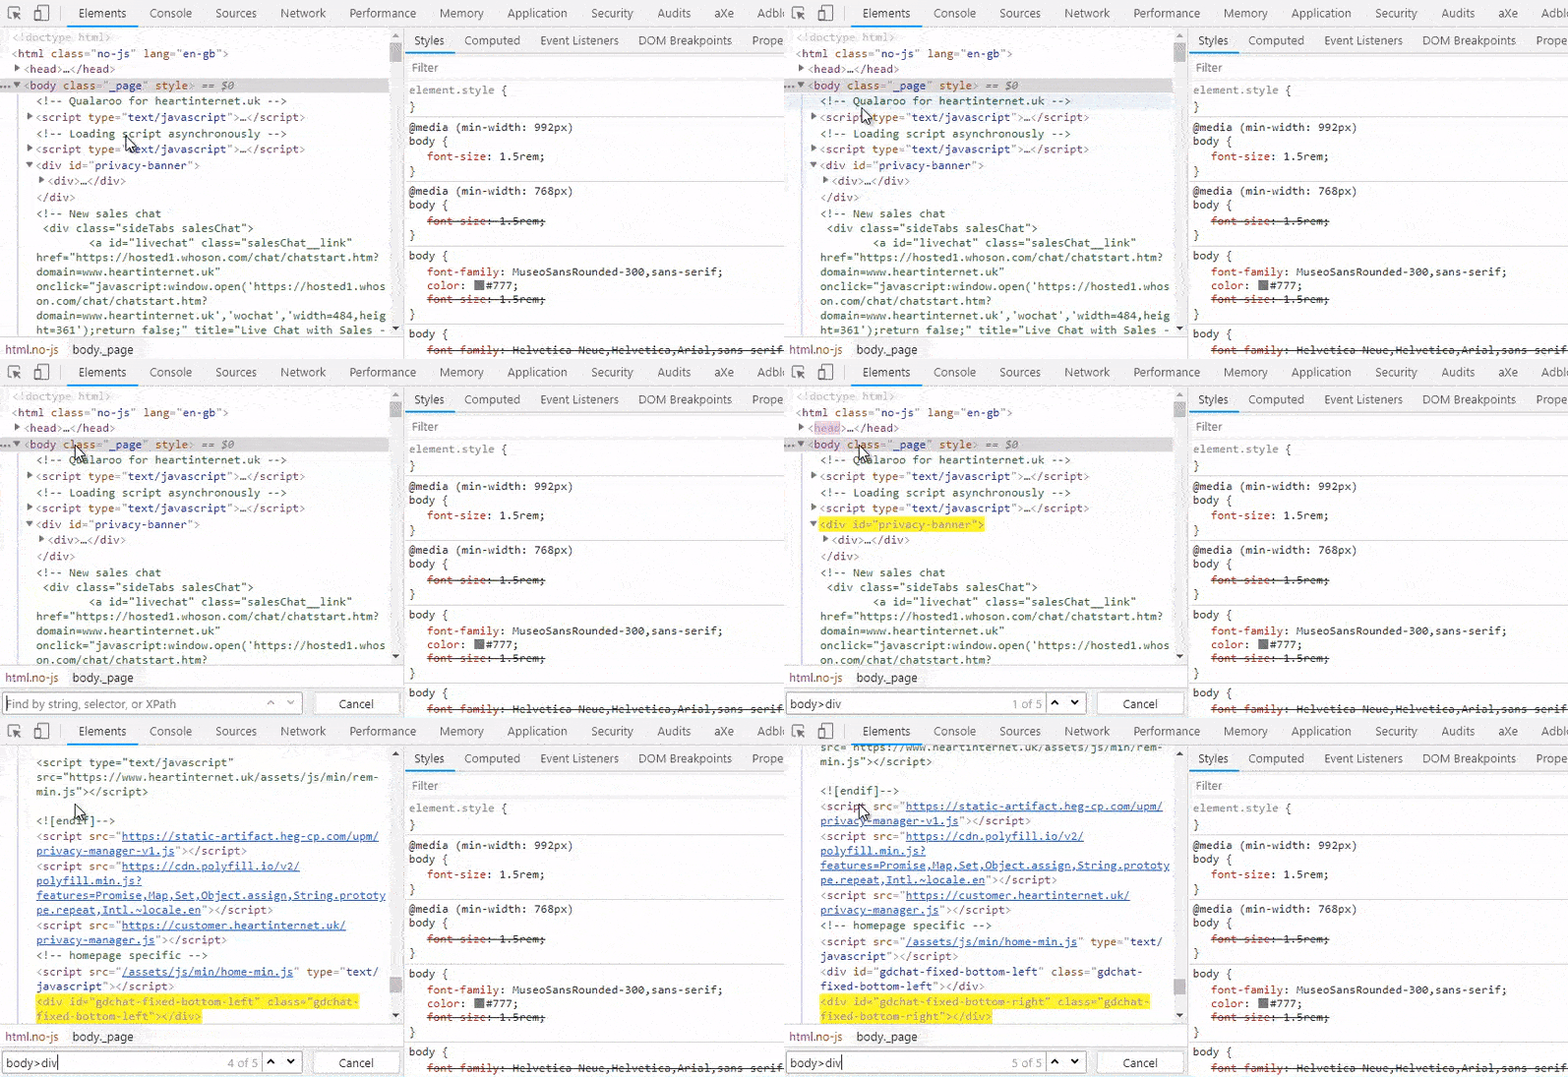
As mentioned above, these searches can be completed with any legal selector, similar to JavsScript's querySelector() and querySelectorAll() methods .
Editing the box model directly
The box model is one of the first things you learn when you start using CSS. Since this is an important part of CSS layout, the developer tools allow you to edit the box model directly.
If you inspect an element on the page, click the Computed panel next to the Styles panel on the right panel. You'll see a visual box model illustration of the element, with the values for each part:
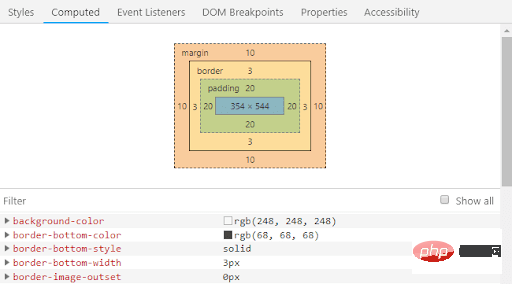
But maybe you didn't know that you can double-click on these values to edit them:
Any changes you make will be reflected on the page in the same way as when you edit CSS in the Styles panel.
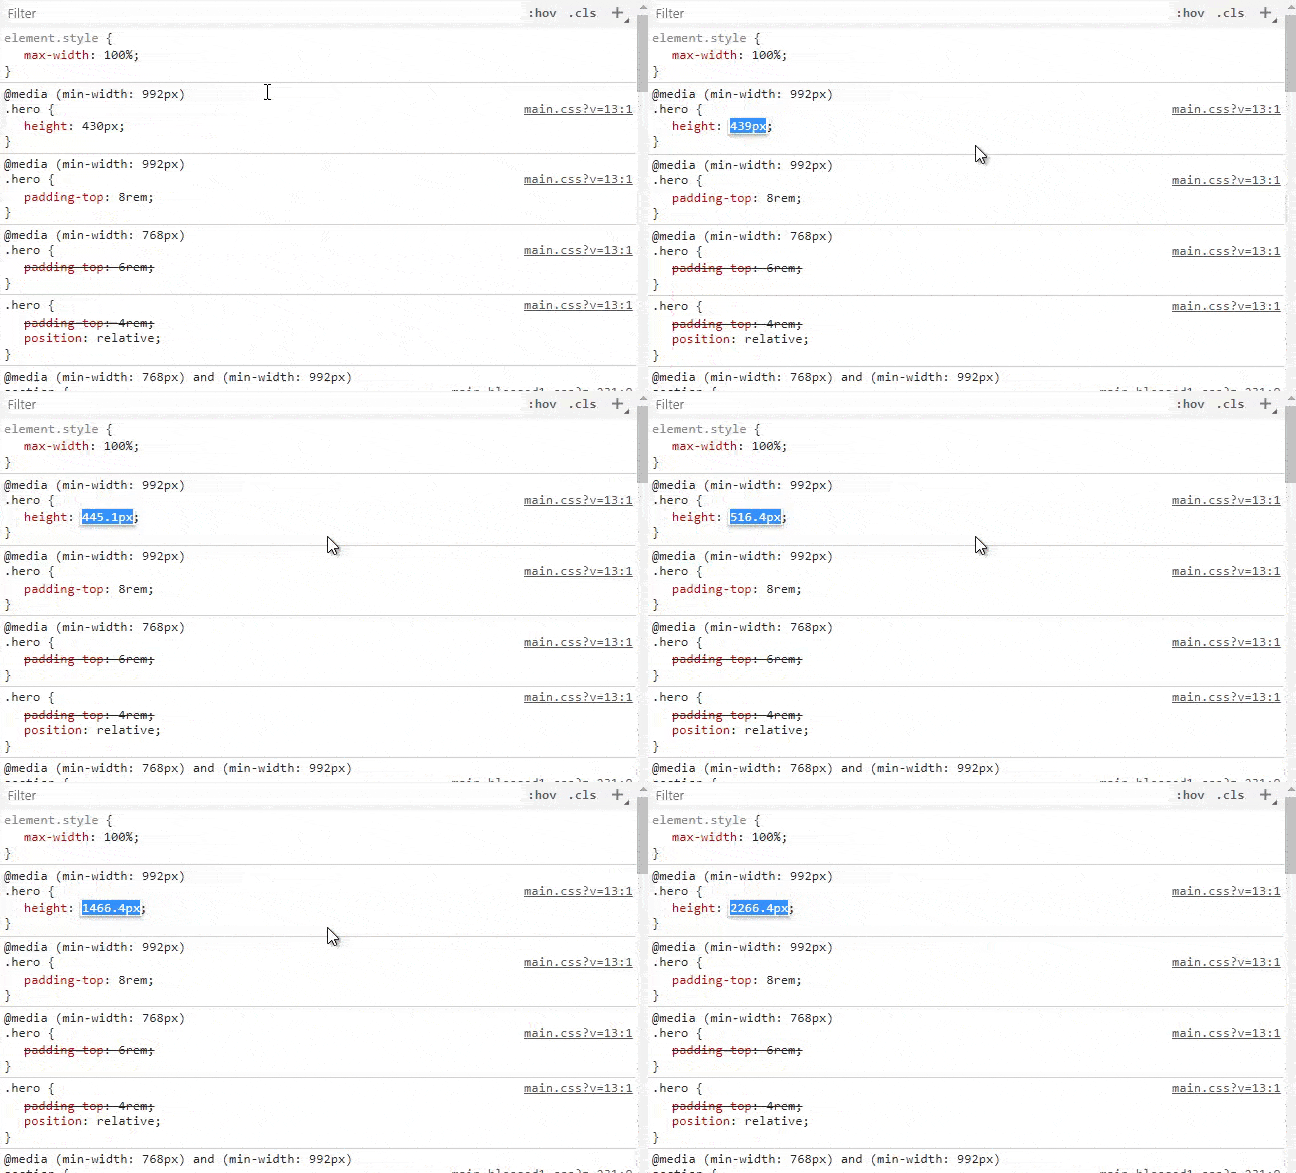
Increment or decrement property values in the Styles panel
You may have realized that you can edit CSS in the Styles panel. Just click on the property or value and type changes.
But maybe you didn't realize that numerical values can be incremented or decremented in different ways.
The up arrow key/down arrow key can increase/decrease the attribute value by 1
ALT up arrow key/down arrow key can use The attribute value can be incremented/decremented by 0.1
SHIFT Up arrow key/Down arrow key can increase/decrease the attribute value by 10
CTRL Up The arrow keys/down arrow keys can increase/decrease the attribute value by 100

You can also use the Page Up or Page Down button instead of the arrow keys.
The text editor function of the "Sources" panel
You may be more familiar with editing in the Styles panel than elsewhere. However, the Sources panel is a highly underestimated feature of developer tools. , which mimics the way regular code editors and IDEs work.
Here are some useful things you can do in the Sources panel (open the developer tools and click the "Sources" button).
Use the CTRL key for multiple selections
If you need to select multiple areas in a single file, you can do so by holding down the CTRL key and selecting Required content to accomplish this, even if it is not continuous text.
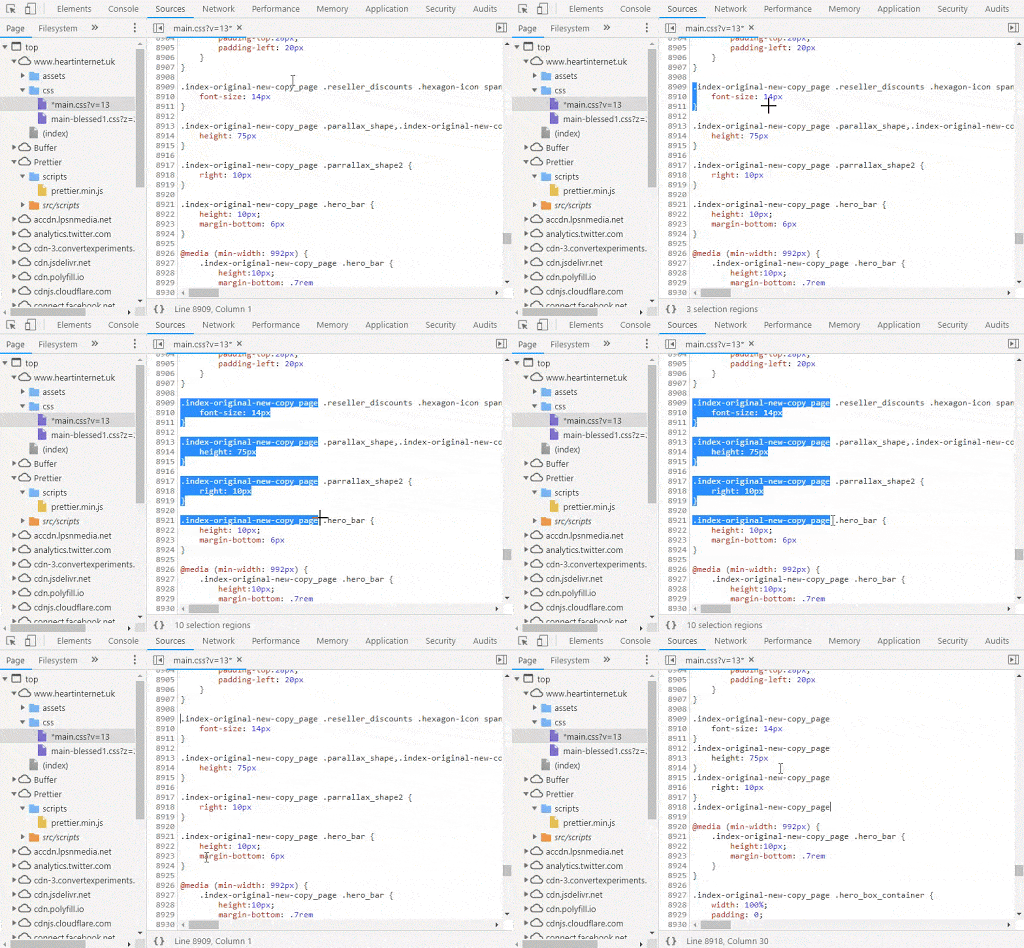
In the demo above, I selected three arbitrary sections of the main.css file in the Sources panel and pasted them back into the document. In addition, you can input in multiple places at the same time with multiple cursors, just use the CTRL key to click multiple locations.
Using the ALT key to select columns
Sometimes, you may want to select a column of text, but usually this is not possible. Some text editors allow you to do this using the ALT key, as well as in the Sources panel.

Use the CTRL SHIFT O key combination to search for elements through the CSS selector
After opening the file in the Sources panel, press the CTRL SHIFT O key combination to open it An input box allows you to jump to any place, which is a famous feature of Sublime.
After pressing CTRL SHIFT O, you can enter the CSS selector for the element you want to find in this file. The developer tools will provide you with matching options. Click to jump to the specified location in the file.
Responsive Design Features in Chrome and Firefox
You may have seen some tools that let you test your responsive layout with just a few clicks For websites, you can actually do the same thing using Chrome's device mode.
Open your developer tools and click the "Toggle device toolbar" button in the upper left corner (shortcut key CTRL SHIFT M):

As you can see , the Devices toolbar has several options for changing the view based on device size and device type, and you can even make changes manually by manually adjusting the width and height values or dragging the handles in the viewport area.
Firefox’s additional “@media rules” panel has similar functionality, allowing you to click breakpoints from within your site’s stylesheet. You can see me using it on one of my websites in the demo below.

DevTools’ Color Function
Handling color values in CSS is the norm. Developer tools make it easier to edit and test color values. Here's what you can do:
Contrast
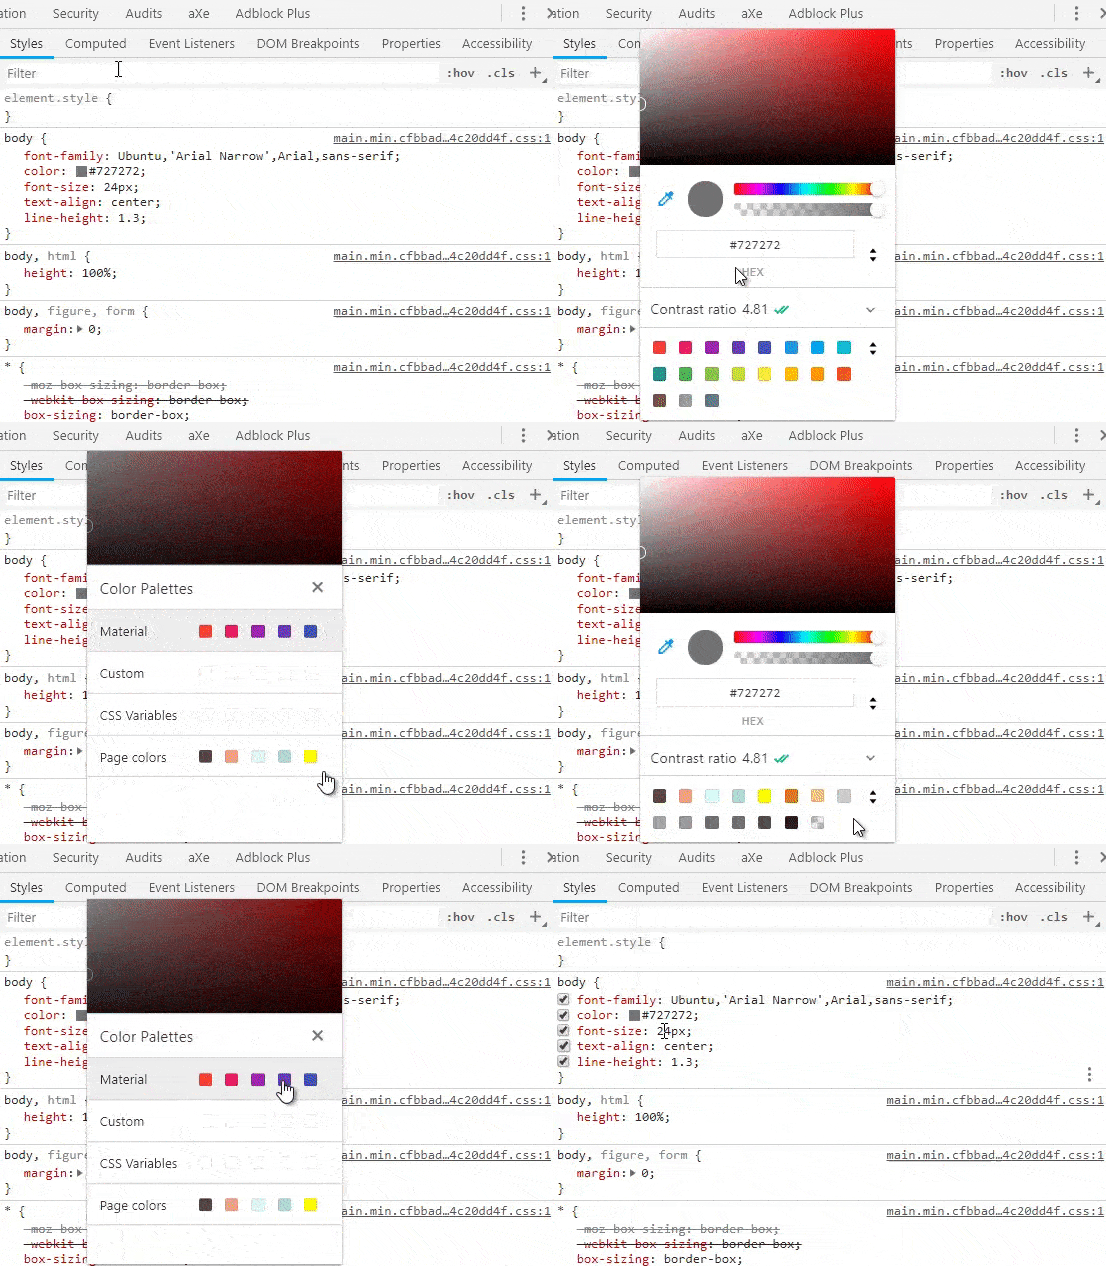
First of all, the developer tools have a View Accessibility feature when you're in the Styles panel When you see the Color property value, you can click the square next to the color value to open the color picker. Inside the Color Picker, you'll see a Contrast option that indicates whether your chosen text color has accessible contrast when paired with the background.

#As you can see in the demo above, the color picker shows curved white lines in the color spectrum. This line indicates where the minimum acceptable contrast begins and ends. As I move the color values above the white line, the green tick next to Contrast will disappear, indicating poor contrast.
Palette
In addition to checking accessibility features, you can also access different color palettes, including the Material Design palette and the color palette associated with the currently viewed page.

Switch color value syntax
Finally, a little-known little trick in the developer tools The knowledge is that you can toggle the syntax of color values when viewing them. By default, the Styles panel displays the syntax for colors written in CSS. But the developer tools allow you to hold down shift and click the small square to the left of the color value to switch the color value between hex, RGBA and HSLA. The syntax is:
Edit CSS Shadow
The CSS for text-shadow and box-shadow is tedious to write by hand, the syntax is easy to forget, and the syntax for the two shadows is slightly different.
Conveniently, Chrome's developer tools allow you to add text-shadow or box-shadow using the visual editor.

As shown in the demo, you can add text-shadow or box-shadow to any element using the options bar in the lower right corner of any style in the Styles panel. After the shadow is added, you can edit the different property values using the visual editor. Existing shadows can be recalled from the visual editor by clicking on the small square to the left of the attribute value.
Firefox’s Grid Layout Checker
Most commonly used browsers now support Grid layout, and more and more developers use them as the default layout method. Firefox's developer tools now feature the Grid option in the Layout tab.

This feature allows you to enable a full coverage grid to help visualize different parts of the Grid layout. You can also display row numbers, zone names, and even choose to extend the grid lines infinitely - if that's useful to you. In the sample demo, I'm using Jen Simmons' sample website, which is responsive, so you can see the benefits of the visual grid when the layout changes for different viewports.
Firefox’s CSS filter editor
filter is another new feature that is now supported almost on both mobile and PC. Firefox once again provides a useful little tool to help you edit filter values.
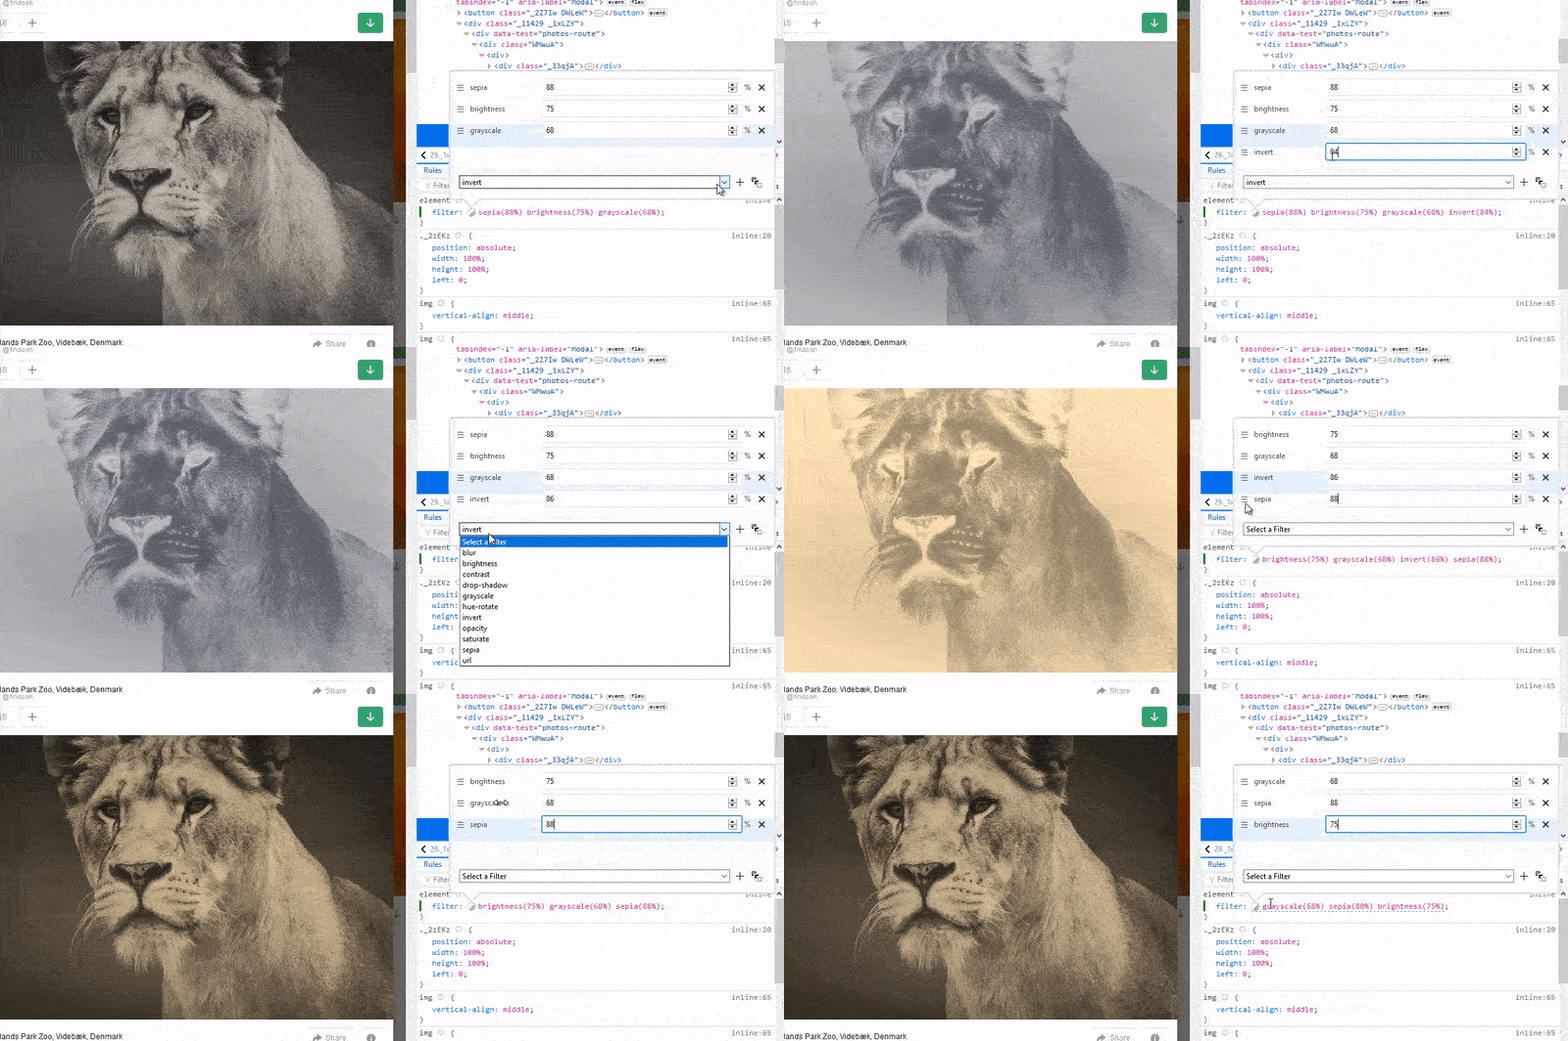
Once you have the filter in your code (tip: if you don't know the actual syntax, you can write filter: none first), you will notice that there is a black and white to the left of the filter value Stack blocks, click on it to open the filter editor.

#You can add multiple filters to a single value, delete a single filter value, and drag and drop individual filters to rearrange the order in which they are applied.

Edit CSS animation in the Styles panel of Chrome
It is very simple to edit static elements in the Styles panel of Chrome, then edit using animation Properties and animations created by @keyframes?
The developer tools have two methods for editing animations. First, when you inspect an element or select an element in the Elements panel, all styles for that element appear in the Styles panel - including defined @keyframes. In the demo below, I select an animated element and adjust some keyframe settings.
But that’s not all, Chrome’s developer tools provide an Animation panel that allows you to edit an animation and its different parts using a visual timeline. You can click the "Customize and control DevTools" button (three vertical dot buttons) in the upper right corner of the developer tools, select more tools, and open the Animations panel.
As shown above, you can edit the timeline of each animated element, and then once you're done editing, you can browse the animation to see the changes on the page. This is a cool feature for designing and debugging complex CSS animations!
View Unused CSS in DevTools
There are a lot of tools these days that can help you track down CSS that is not used on a specific page. This gives you the option to remove them completely or load them only when necessary. This will have obvious performance advantages.
Chrome allows you to view unused CSS through the “Coverage” panel of the developer tools. This panel can be opened by clicking the "Customize and control DevTools" option (three vertical dot buttons) in the upper right corner of the developer panel as mentioned above, selecting "More Tools" and finding "Coverage".
As shown in the demo, once you open the Coverage panel, you can open a source file in the Sources panel. When the file opens, you will notice that each style in the CSS file has a green or red line to the right, indicating whether the style is applied to the current page.
Conclusion
Your browser development tools are a treasure trove of CSS editing and debugging. When you combine the above suggestions with Chrome features like Workspaces (which allow you to save changes made in the developer tools to local files), the entire debugging process becomes more complete.
I hope these tips and suggestions will improve your ability to edit and debug CSS in future projects.
The above is the detailed content of 16 DevTools tips you need to know in CSS development. For more information, please follow other related articles on the PHP Chinese website!

Hot AI Tools

Undresser.AI Undress
AI-powered app for creating realistic nude photos

AI Clothes Remover
Online AI tool for removing clothes from photos.

Undress AI Tool
Undress images for free

Clothoff.io
AI clothes remover

AI Hentai Generator
Generate AI Hentai for free.

Hot Article

Hot Tools

Notepad++7.3.1
Easy-to-use and free code editor

SublimeText3 Chinese version
Chinese version, very easy to use

Zend Studio 13.0.1
Powerful PHP integrated development environment

Dreamweaver CS6
Visual web development tools

SublimeText3 Mac version
God-level code editing software (SublimeText3)

Hot Topics
 1379
1379
 52
52
 The Roles of HTML, CSS, and JavaScript: Core Responsibilities
Apr 08, 2025 pm 07:05 PM
HTML defines the web structure, CSS is responsible for style and layout, and JavaScript gives dynamic interaction. The three perform their duties in web development and jointly build a colorful website.
 How to use bootstrap in vue
Apr 07, 2025 pm 11:33 PM
Using Bootstrap in Vue.js is divided into five steps: Install Bootstrap. Import Bootstrap in main.js. Use the Bootstrap component directly in the template. Optional: Custom style. Optional: Use plug-ins.
 How to write split lines on bootstrap
Apr 07, 2025 pm 03:12 PM
There are two ways to create a Bootstrap split line: using the tag, which creates a horizontal split line. Use the CSS border property to create custom style split lines.
 How to insert pictures on bootstrap
Apr 07, 2025 pm 03:30 PM
There are several ways to insert images in Bootstrap: insert images directly, using the HTML img tag. With the Bootstrap image component, you can provide responsive images and more styles. Set the image size, use the img-fluid class to make the image adaptable. Set the border, using the img-bordered class. Set the rounded corners and use the img-rounded class. Set the shadow, use the shadow class. Resize and position the image, using CSS style. Using the background image, use the background-image CSS property.
 How to resize bootstrap
Apr 07, 2025 pm 03:18 PM
To adjust the size of elements in Bootstrap, you can use the dimension class, which includes: adjusting width: .col-, .w-, .mw-adjust height: .h-, .min-h-, .max-h-
 How to set up the framework for bootstrap
Apr 07, 2025 pm 03:27 PM
To set up the Bootstrap framework, you need to follow these steps: 1. Reference the Bootstrap file via CDN; 2. Download and host the file on your own server; 3. Include the Bootstrap file in HTML; 4. Compile Sass/Less as needed; 5. Import a custom file (optional). Once setup is complete, you can use Bootstrap's grid systems, components, and styles to create responsive websites and applications.
 How to use bootstrap button
Apr 07, 2025 pm 03:09 PM
How to use the Bootstrap button? Introduce Bootstrap CSS to create button elements and add Bootstrap button class to add button text
 How to view the date of bootstrap
Apr 07, 2025 pm 03:03 PM
Answer: You can use the date picker component of Bootstrap to view dates in the page. Steps: Introduce the Bootstrap framework. Create a date selector input box in HTML. Bootstrap will automatically add styles to the selector. Use JavaScript to get the selected date.


