How to check jvm and thread usage
How to check jvm and thread usage: execute the [jmap -heap PID] command to check the jvm usage; execute the [jstack pid] command to check the thread usage.

View jvm usage
(Video tutorial recommendation: java course)
jmap -heap PID
View Thread usage
jstack pid
jstack is a stack tracing tool that comes with the Java virtual machine and is used to generate a thread snapshot of the current moment of the Java virtual machine.
Thread snapshots are a collection of method stacks being executed by each thread in the current Java virtual machine. The main purpose of generating thread snapshots is to locate the reasons for long pauses in threads, such as inter-thread deadlocks, infinite loops, etc. Long waits caused by requesting external resources, etc.
When a thread pauses, you can check the call stack of each thread through jstack to know what the unresponsive thread is doing in the background or what resources it is waiting for. If the Java program crashes and generates a core file, the jstack tool can be used to obtain the Java stack and native stack information of the core file, so that you can easily know how the Java program crashed and where the problem occurred in the program.
In addition, the jstack tool can also be attached to the running java program to see the java stack and native stack information of the java program running at that time. If the java program currently running is in a hung state, jstack is Very useful.
Related recommendations:Getting started with java
The above is the detailed content of How to check jvm and thread usage. For more information, please follow other related articles on the PHP Chinese website!

Hot AI Tools

Undresser.AI Undress
AI-powered app for creating realistic nude photos

AI Clothes Remover
Online AI tool for removing clothes from photos.

Undress AI Tool
Undress images for free

Clothoff.io
AI clothes remover

AI Hentai Generator
Generate AI Hentai for free.

Hot Article

Hot Tools

Notepad++7.3.1
Easy-to-use and free code editor

SublimeText3 Chinese version
Chinese version, very easy to use

Zend Studio 13.0.1
Powerful PHP integrated development environment

Dreamweaver CS6
Visual web development tools

SublimeText3 Mac version
God-level code editing software (SublimeText3)

Hot Topics
 1386
1386
 52
52
 C++ Concurrent Programming: How to avoid thread starvation and priority inversion?
May 06, 2024 pm 05:27 PM
To avoid thread starvation, you can use fair locks to ensure fair allocation of resources, or set thread priorities. To solve priority inversion, you can use priority inheritance, which temporarily increases the priority of the thread holding the resource; or use lock promotion, which increases the priority of the thread that needs the resource.
 A distributed JVM monitoring tool, very practical!
Aug 15, 2023 pm 05:15 PM
This project is designed to facilitate developers to monitor multiple remote host JVMs faster. If your project is Spring boot, it is very easy to integrate. Just introduce the jar package. If it is not Spring boot, don’t be discouraged. You can quickly initialize a Spring boot program and introduce it yourself. Jar package is enough
 C++ Concurrent Programming: How to do thread termination and cancellation?
May 06, 2024 pm 02:12 PM
Thread termination and cancellation mechanisms in C++ include: Thread termination: std::thread::join() blocks the current thread until the target thread completes execution; std::thread::detach() detaches the target thread from thread management. Thread cancellation: std::thread::request_termination() requests the target thread to terminate execution; std::thread::get_id() obtains the target thread ID and can be used with std::terminate() to immediately terminate the target thread. In actual combat, request_termination() allows the thread to decide the timing of termination, and join() ensures that on the main line
 Detailed explanation of JVM command line parameters: the secret weapon to control JVM operation
May 09, 2024 pm 01:33 PM
JVM command line parameters allow you to adjust JVM behavior at a fine-grained level. The common parameters include: Set the Java heap size (-Xms, -Xmx) Set the new generation size (-Xmn) Enable the parallel garbage collector (-XX:+UseParallelGC) Reduce the memory usage of the Survivor area (-XX:-ReduceSurvivorSetInMemory) Eliminate redundancy Eliminate garbage collection (-XX:-EliminateRedundantGCs) Print garbage collection information (-XX:+PrintGC) Use the G1 garbage collector (-XX:-UseG1GC) Set the maximum garbage collection pause time (-XX:MaxGCPau
 Java Error: JavaFX thread stuck error, how to deal with and avoid it
Jun 24, 2023 pm 05:52 PM
During the development of JavaFX applications, we often encounter JavaFX thread stuck errors. Such errors vary in severity and may adversely affect program stability and performance. In order to ensure the normal operation of the program, we need to understand the causes and solutions of JavaFX thread stuck errors, and how to prevent this error from occurring. 1. The cause of JavaFX thread stuck error. JavaFX is a multi-threaded UI application framework, which allows programs to execute for a long time in background threads.
 JVM memory management key points and precautions
Feb 20, 2024 am 10:26 AM
Key points and precautions for mastering JVM memory usage JVM (JavaVirtualMachine) is the environment in which Java applications run, and the most important one is the memory management of the JVM. Properly managing JVM memory can not only improve application performance, but also avoid problems such as memory leaks and memory overflows. This article will introduce the key points and considerations of JVM memory usage and provide some specific code examples. JVM memory partitions JVM memory is mainly divided into the following areas: Heap (He
 Analysis of the difference between threads and processes in Go language
Apr 03, 2024 pm 01:39 PM
Processes and threads in Go language: Process: an independently running program instance with its own resources and address space. Thread: An execution unit within a process that shares process resources and address space. Features: Process: high overhead, good isolation, independent scheduling. Threads: low overhead, shared resources, internal scheduling. Practical case: Process: Isolating long-running tasks. Threads: Process large amounts of data concurrently.
 Microsoft plans to introduce AI-powered Copilot to Outlook classic app on Windows
Oct 19, 2023 pm 11:13 PM
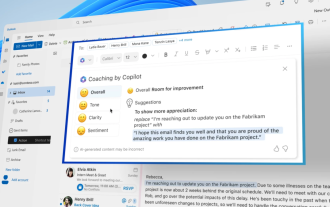
Microsoft apparently won't keep its powerful AI-powered Copilot tool as an exclusive feature of the new app. Now, the company has just announced plans to bring Copilot to the Outlook classic app on Windows. As posted on its 365 Roadmap website, previews will begin in March next year and will roll out globally on desktops in the current channel until March. Copilot is a productivity tool that uses large language models (LLMs) to help users with tasks such as writing emails, summarizing documents, and translating languages. One of its main features is its ability to summarize emails


