1 <p id="EchartsBarDemo" style="width:100%;height:600px"></p>
What are the UI frameworks based on bootstrap?
The UI frameworks based on bootstrap include: 1. AdminLTE framework; 2. ACE framework; 3. clearmin framework; 4. h-ui framework; 5. Echats framework, etc.

Recommended: "bootstrap tutorial"
A brief discussion of several mainstream front-end frameworks based on the bootstrap framework
1 Overview
When developing a new project or product, technology selection is an indispensable link. Software architecture plays a decisive role. It can be said that the quality of technology selection directly affects the success or failure of the project or product. Therefore, when doing software architecture, you must think about technology selection. The traditional model of coupling the front and back ends together cannot basically meet the needs of big data and high concurrency in the current environment. For example, the WebForm model of .NET is gradually replaced by MVC, MVC Gradually replacing WebForm, there are two important reasons: MVC is completely separated from the front and back ends and MVC has better versatility. From the perspective of architecture, we abstract the software architecture into two parts, namely the front end and the back end, both of which transmit data through interfaces. But in this article, I will not talk about architecture, but just share with you several more mainstream front-end frameworks based on Bootsrap.
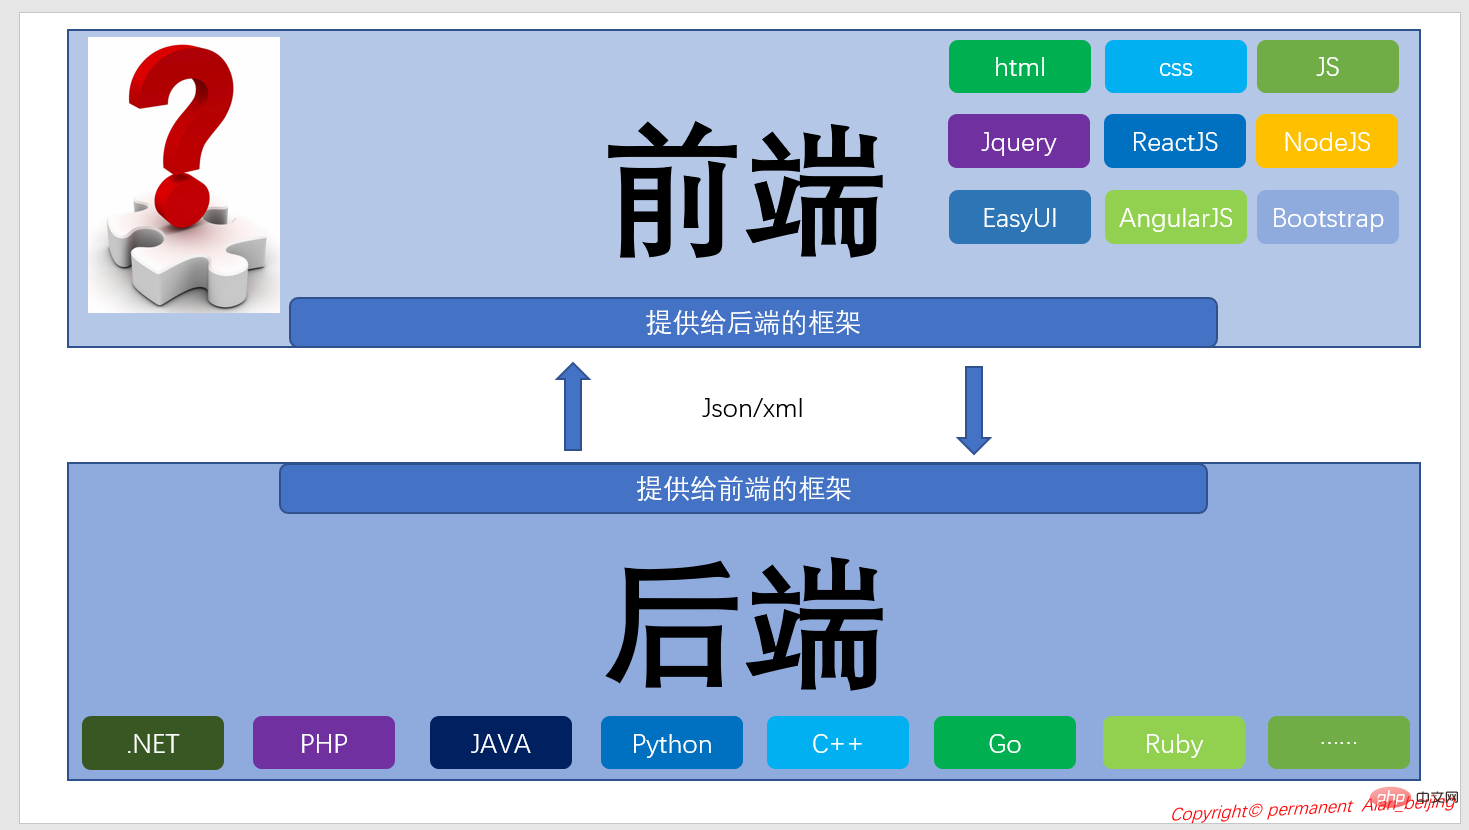
Several popular front-end frameworks (1) AdminLTE
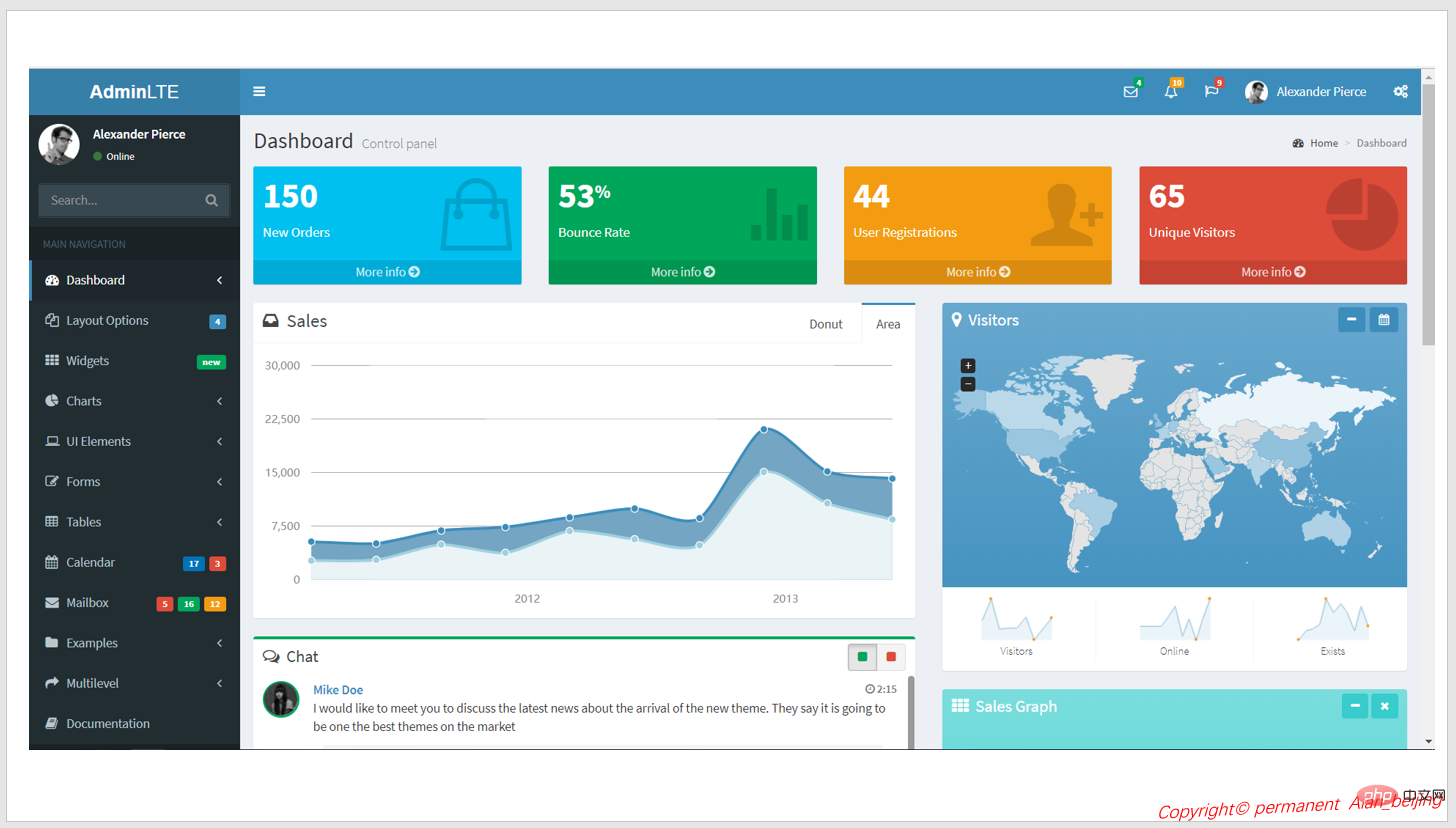 1. Reference URL: https://adminlte.io/
2. Open source
3.Bootstrap3 framework
4. Lightweight
5. Fully responsive, supports customization
6.github:https://github.com/almasaeed2010/AdminLTE
(2) ACE framework
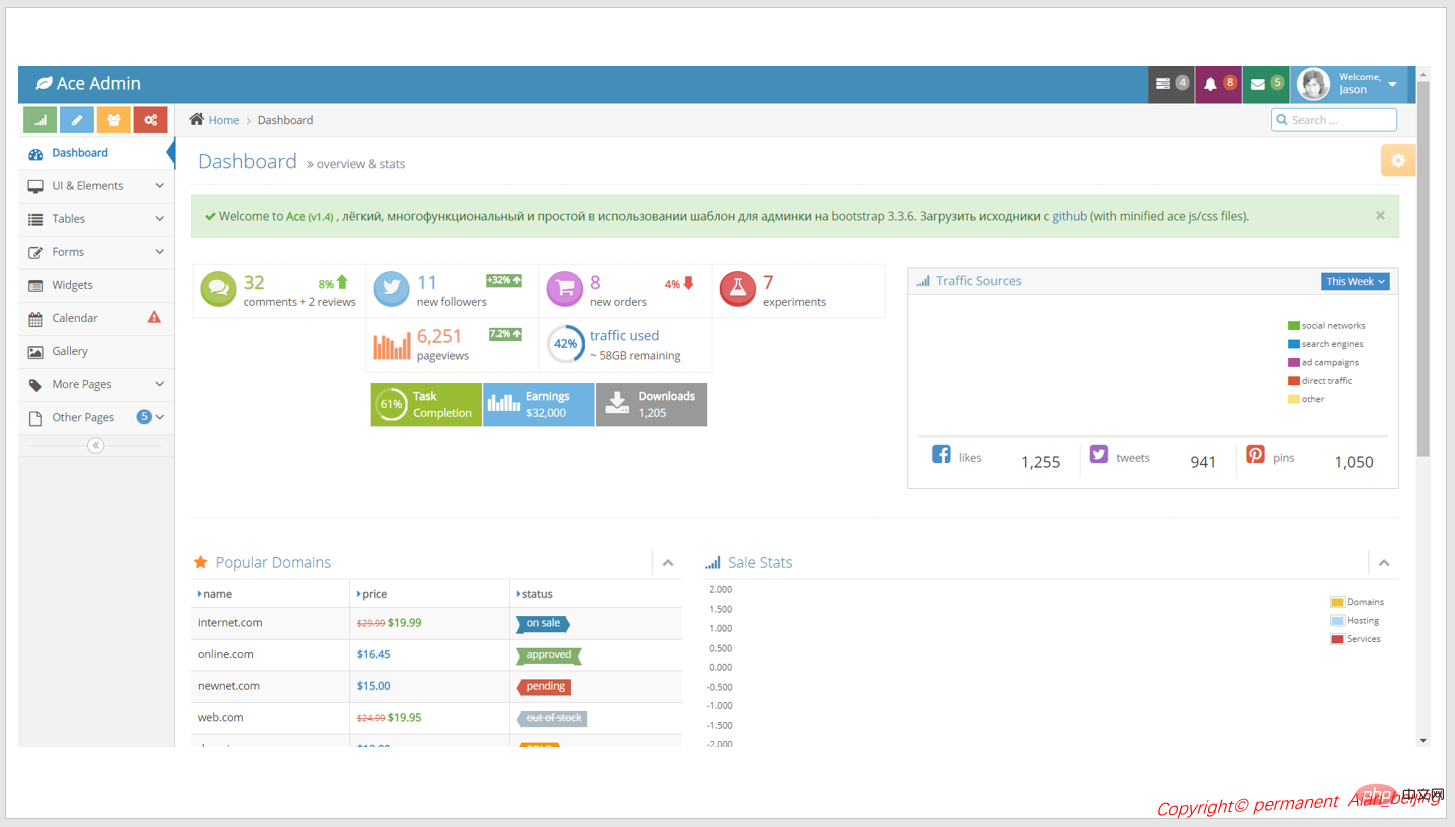 1. Reference URL: http://ace.jeka.by/
2. Backend template developed by Twitter bootstrap3
3. Open source
4.github:https://github.com/bopoda/ace
(3) clearmin
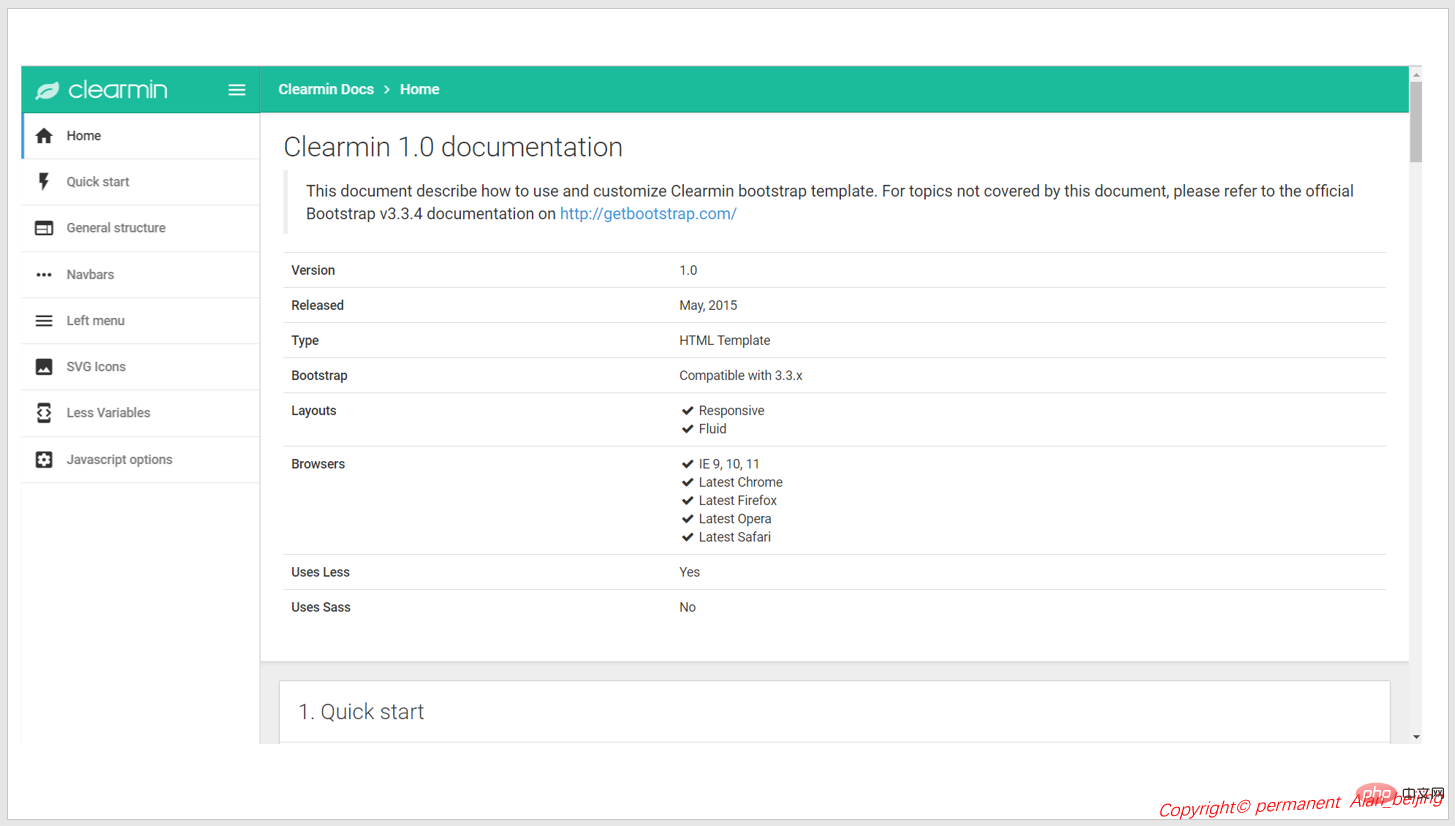 1 .Reference URL: http://cm.paomedia.com/
2. Developed based on Bootstrap3 framework
3.github:https://github.com/paomedia/clearmin
(4) h-ui
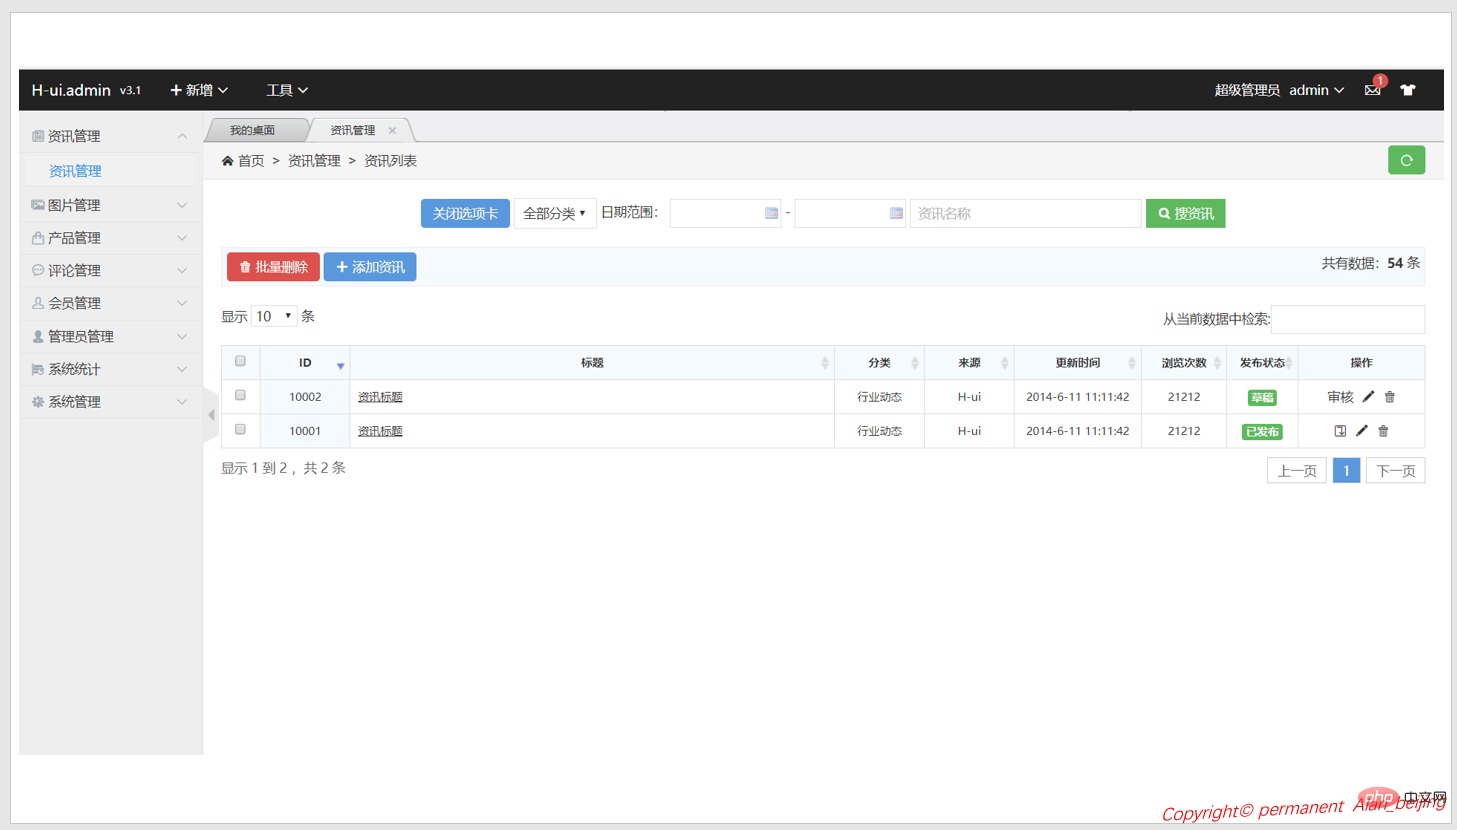 1. Reference website: http://www.h-ui.net/H-ui.admin.shtml
2.H-ui.admin is a lightweight website backend template developed using the H-ui front-end framework. It uses native HTML language. It is completely free, simple and flexible, and has good compatibility, allowing you to quickly build small and medium-sized website backends.
(五)Echats
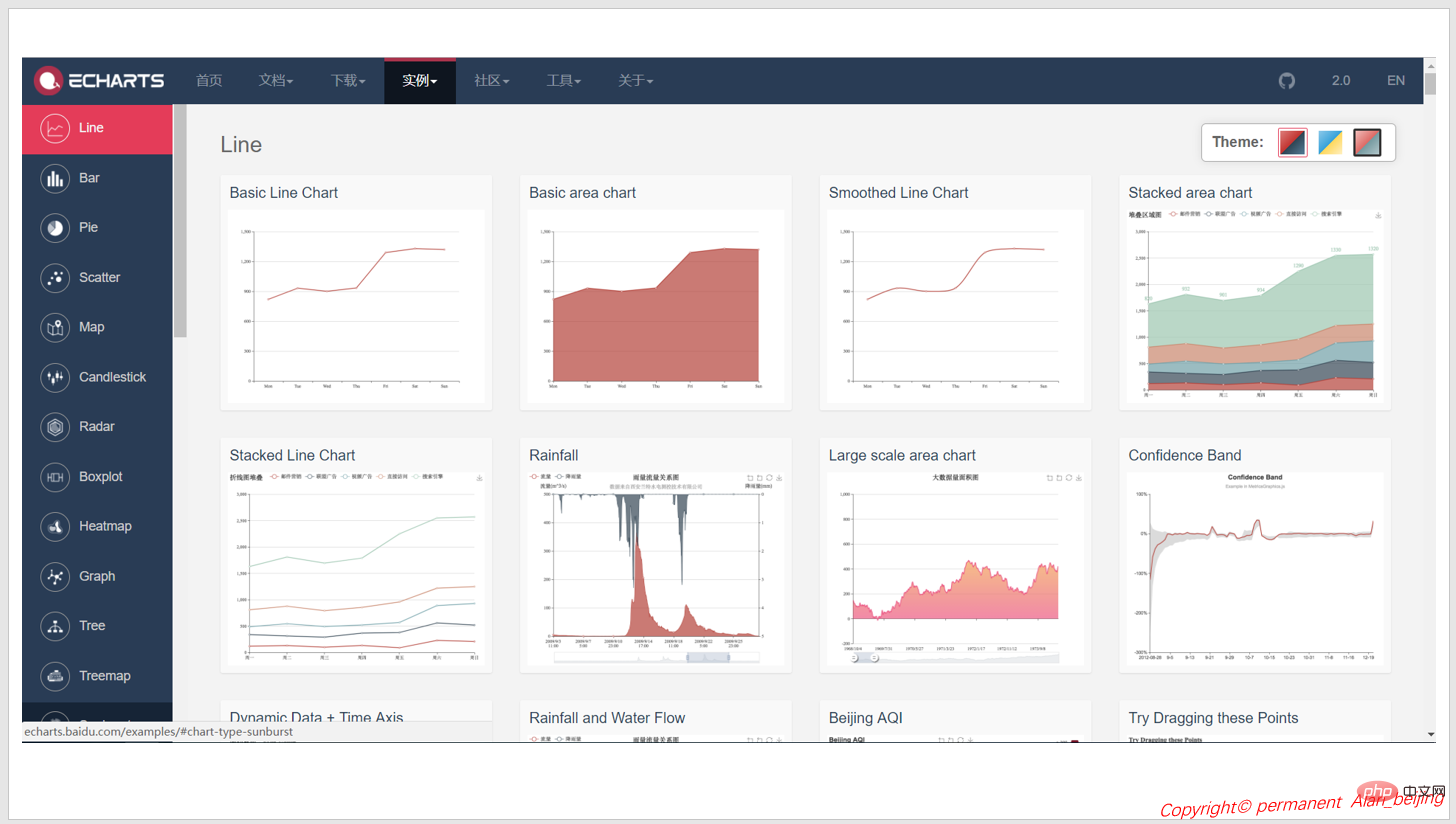 1. Reference URL: http://echarts.baidu.com/
2. By Baidu Team development, completely developed with js, powerful functions, various types of reports
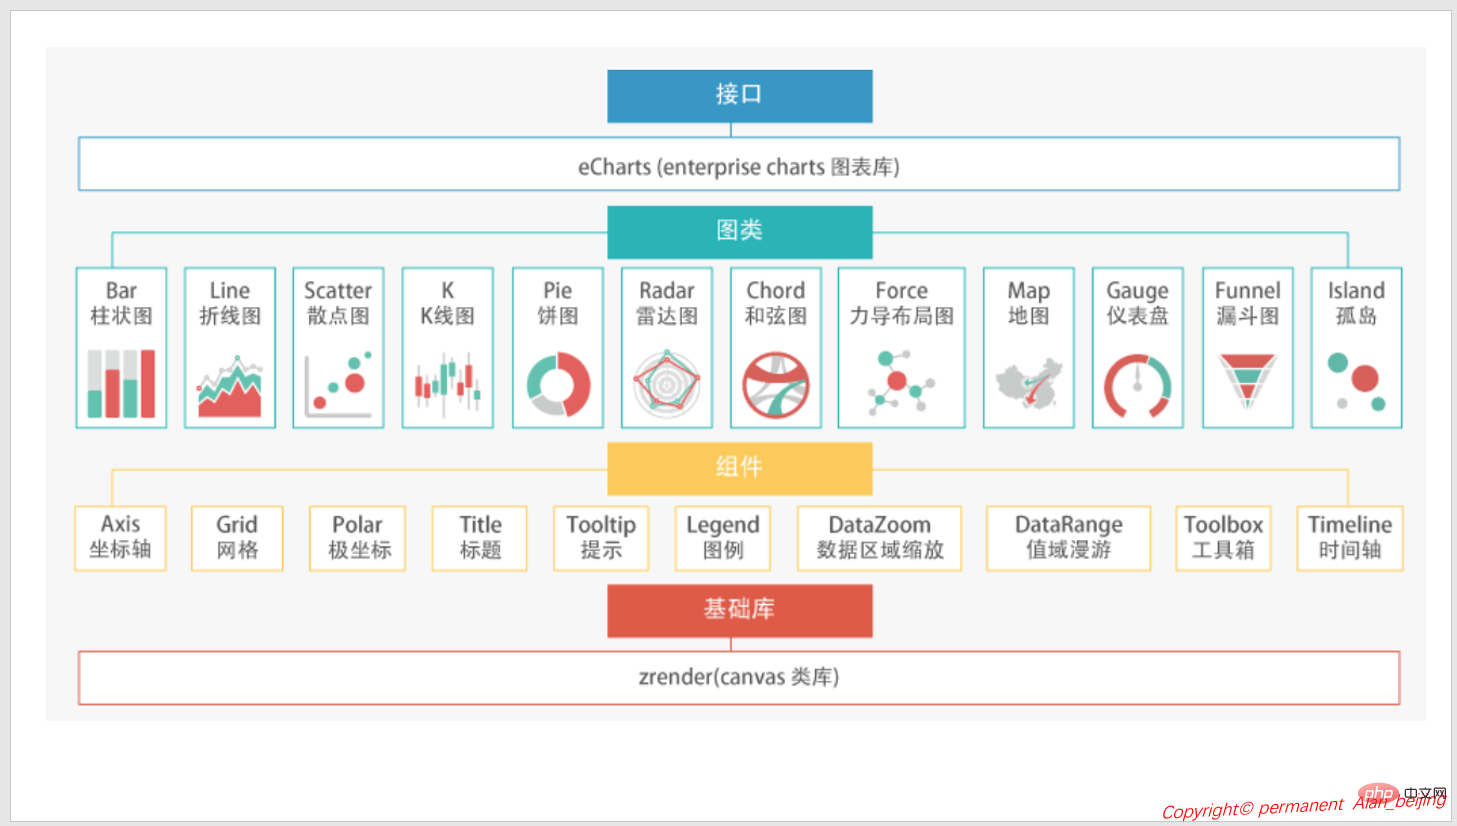
Three Echarts architecture diagramAs above Although I recommend five sets of front-end frameworks to everyone, the author recommends the AdminLTE H-ui Echarts combination model, which is also the combination model I currently use in software architecture.
Echarts Framework
(1) Take a look at the DEMO renderings first
Dynamic effects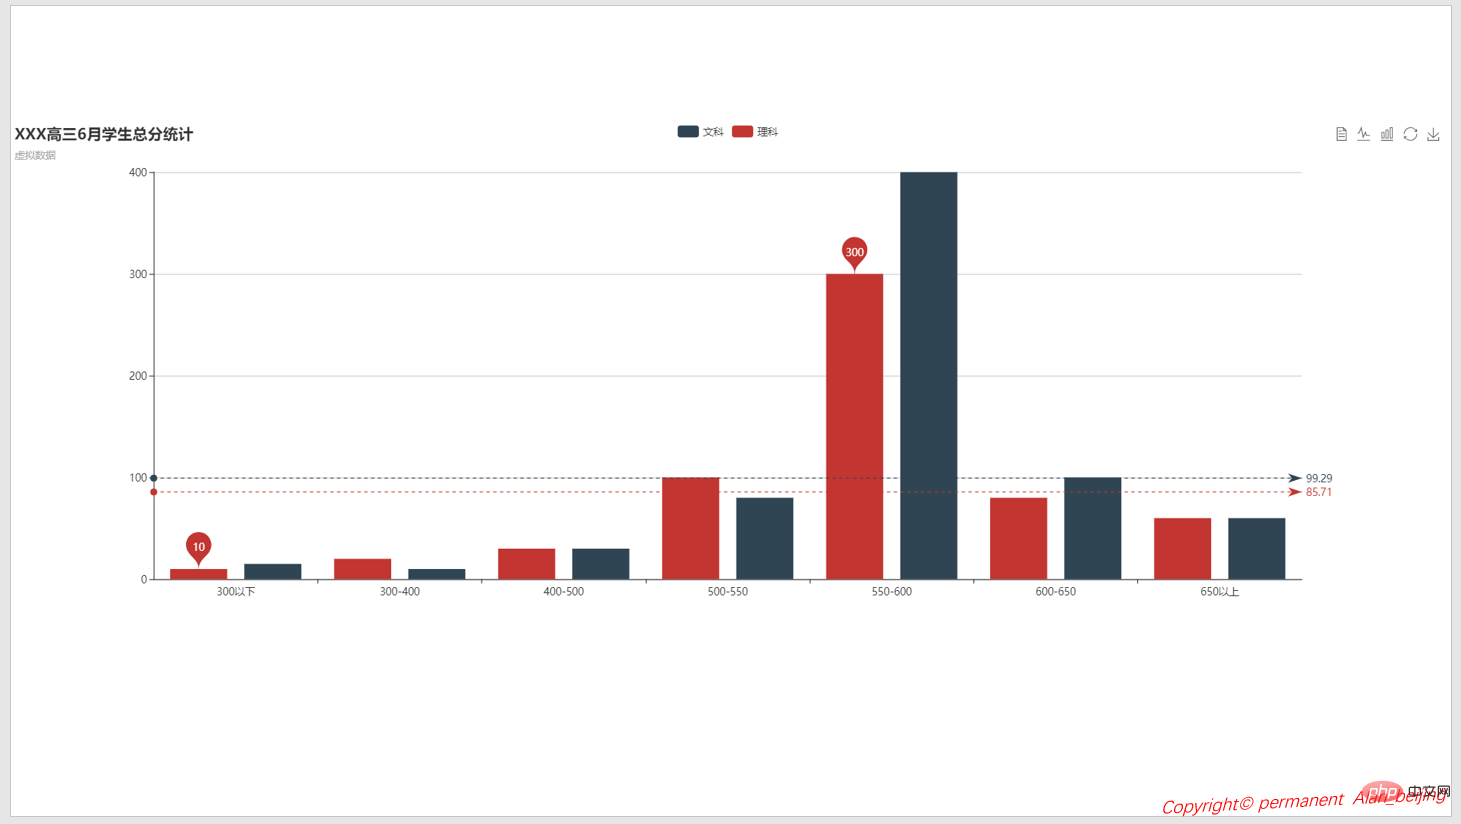
1. Supports a variety of Automatic report switching, such as Line, Bar, etc.; 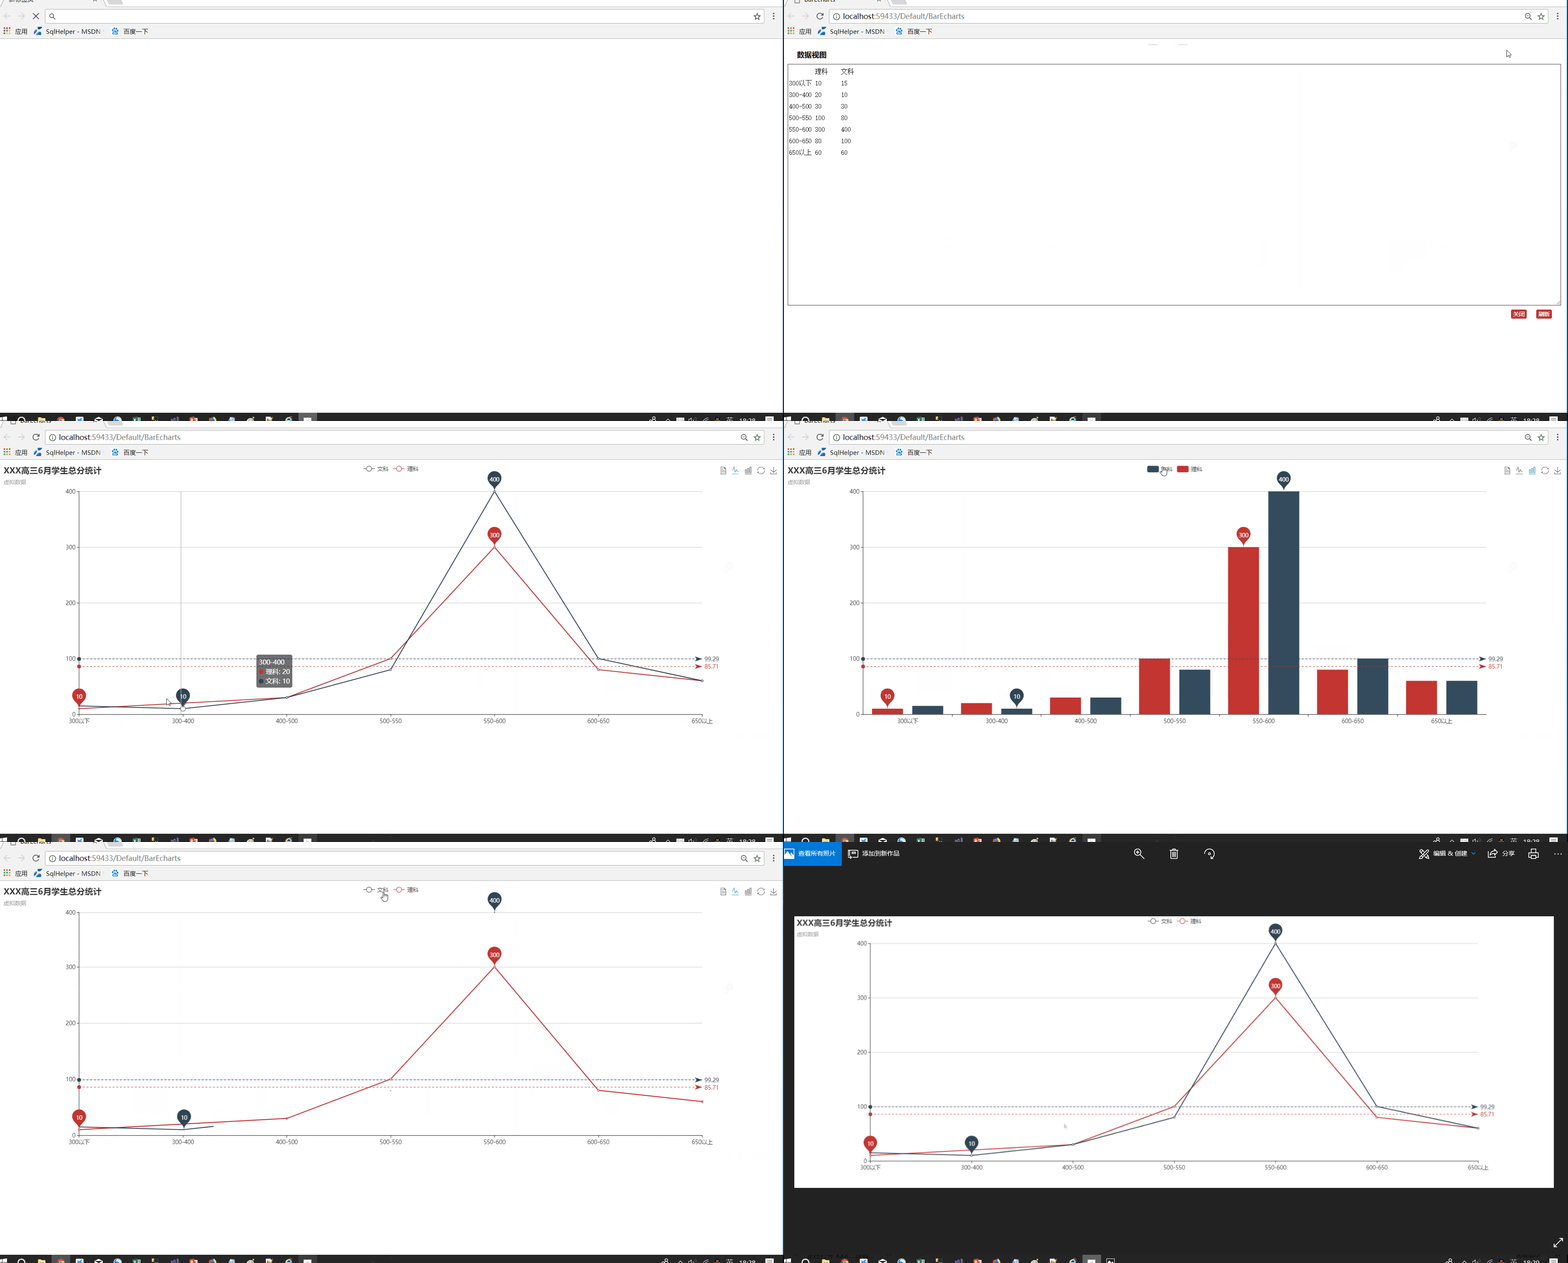
1 <p id="EchartsBarDemo" style="width:100%;height:600px"></p>
Copy after login
2. Initialize
1 <p id="EchartsBarDemo" style="width:100%;height:600px"></p>
1 var myChart = echarts.init(document.getElementById('EchartsBarDemo'));var option = {
title: {
text: 'XXX高三6月学生总分统计',
subtext: '虚拟数据'
},
tooltip: {
trigger: 'axis'
},
legend: {
data: ['文科', '理科']
},
toolbox: {
show: true,
feature: {
mark: { show: true },
dataView: { show: true, readOnly: false },
magicType: { show: true, type: ['line', 'bar'] },
restore: { show: true },
saveAsImage: { show: true }
}
},
calculable: true,
xAxis: [
{
type: 'category',
data: ['300以下', '300-400', '400-500', '500-550', '550-600', '600-650', '650以上']
}
],
yAxis: [
{
type: 'value'
}
],
series: [
{
name: '理科',
type: 'bar',
data: LiKeScores,
markPoint: {
data: [
{ type: 'max', name: '最大值' },
{ type: 'min', name: '最小值' }
]
},
markLine: {
data: [
{ type: 'average', name: '平均值' }
]
}
},
{
name: '文科',
type: 'bar',
data: WenKeScores,
markPoint: {//标注点
data: [
{ type: 'max', name: '最大值' },
{ type: 'min', name: '最小值' }
]
},
markLine: { //水平线
data: [
{ type: 'average', name: '平均值' } //水平线表示平均值
]
}
}
]
}myChart.setOption(option); // 设置加载等待隐藏 myChart.hideLoading();
public class DefaultController : Controller
{
// GET: Default
public ActionResult BarEcharts()
{
return View();
}
public ContentResult GetScoresJson()
{
//这里只是模拟数据,正式环境需要到db中查询
return Content("{LiKe:[10, 20, 30, 100, 300, 80, 60],WenKe:[15, 10, 30, 80, 400, 100, 60]}");
}
}
BarEcharts
<script>
//初始化
var myChart = echarts.init(document.getElementById('EchartsBarDemo'));
//定义全局变量
//var LiKeScores = [10, 20, 30, 100, 300, 80, 60];
//var WenKeScores = [15, 10, 30, 80, 400, 100, 60];
var LiKeScores = [];
var WenKeScores = [];
var jsonURL = "/Default/GetScoresJson";
$.ajax({
type: 'get',
url: jsonURL,
dataType: "text",
success: function (rspData) {
console.log(rspData);
var str = eval('(' + rspData + ')');
LiKeScores =str.LiKe;
WenKeScores = str.WenKe;
var option = {
title: {
text: &#39;XXX高三6月学生总分统计&#39;,
subtext: &#39;虚拟数据&#39;
},
tooltip: {
trigger: &#39;axis&#39;
},
legend: {
data: [&#39;文科&#39;, &#39;理科&#39;]
},
toolbox: {
show: true,
feature: {
mark: { show: true },
dataView: { show: true, readOnly: false },
magicType: { show: true, type: [&#39;line&#39;, &#39;bar&#39;] },
restore: { show: true },
saveAsImage: { show: true }
}
},
calculable: true,
xAxis: [
{
type: &#39;category&#39;,
data: [&#39;300以下&#39;, &#39;300-400&#39;, &#39;400-500&#39;, &#39;500-550&#39;, &#39;550-600&#39;, &#39;600-650&#39;, &#39;650以上&#39;]
}
],
yAxis: [
{
type: &#39;value&#39;
}
],
series: [
{
name: &#39;理科&#39;,
type: &#39;bar&#39;,
data: LiKeScores,
markPoint: {
data: [
{ type: &#39;max&#39;, name: &#39;最大值&#39; },
{ type: &#39;min&#39;, name: &#39;最小值&#39; }
]
},
markLine: {
data: [
{ type: &#39;average&#39;, name: &#39;平均值&#39; }
]
}
},
{
name: &#39;文科&#39;,
type: &#39;bar&#39;,
data: WenKeScores,
markPoint: {//标注点
data: [
{ type: &#39;max&#39;, name: &#39;最大值&#39; },
{ type: &#39;min&#39;, name: &#39;最小值&#39; }
]
},
markLine: { //水平线
data: [
{ type: &#39;average&#39;, name: &#39;平均值&#39; } //水平线表示平均值
]
}
}
]
}
 myChart.setOption(option);
 // 设置加载等待隐藏
 myChart.hideLoading();
},
error: function (data) {
console.log(data);
LiKeScores = data.LiKe;
WenKeScores = data.WenKe;
//Loading(false);
}
});
</script>Copy after login
2 .Backend
BarEcharts
<script>
//初始化
var myChart = echarts.init(document.getElementById('EchartsBarDemo'));
//定义全局变量
//var LiKeScores = [10, 20, 30, 100, 300, 80, 60];
//var WenKeScores = [15, 10, 30, 80, 400, 100, 60];
var LiKeScores = [];
var WenKeScores = [];
var jsonURL = "/Default/GetScoresJson";
$.ajax({
type: 'get',
url: jsonURL,
dataType: "text",
success: function (rspData) {
console.log(rspData);
var str = eval('(' + rspData + ')');
LiKeScores =str.LiKe;
WenKeScores = str.WenKe;
var option = {
title: {
text: &#39;XXX高三6月学生总分统计&#39;,
subtext: &#39;虚拟数据&#39;
},
tooltip: {
trigger: &#39;axis&#39;
},
legend: {
data: [&#39;文科&#39;, &#39;理科&#39;]
},
toolbox: {
show: true,
feature: {
mark: { show: true },
dataView: { show: true, readOnly: false },
magicType: { show: true, type: [&#39;line&#39;, &#39;bar&#39;] },
restore: { show: true },
saveAsImage: { show: true }
}
},
calculable: true,
xAxis: [
{
type: &#39;category&#39;,
data: [&#39;300以下&#39;, &#39;300-400&#39;, &#39;400-500&#39;, &#39;500-550&#39;, &#39;550-600&#39;, &#39;600-650&#39;, &#39;650以上&#39;]
}
],
yAxis: [
{
type: &#39;value&#39;
}
],
series: [
{
name: &#39;理科&#39;,
type: &#39;bar&#39;,
data: LiKeScores,
markPoint: {
data: [
{ type: &#39;max&#39;, name: &#39;最大值&#39; },
{ type: &#39;min&#39;, name: &#39;最小值&#39; }
]
},
markLine: {
data: [
{ type: &#39;average&#39;, name: &#39;平均值&#39; }
]
}
},
{
name: &#39;文科&#39;,
type: &#39;bar&#39;,
data: WenKeScores,
markPoint: {//标注点
data: [
{ type: &#39;max&#39;, name: &#39;最大值&#39; },
{ type: &#39;min&#39;, name: &#39;最小值&#39; }
]
},
markLine: { //水平线
data: [
{ type: &#39;average&#39;, name: &#39;平均值&#39; } //水平线表示平均值
]
}
}
]
}
myChart.setOption(option);
// 设置加载等待隐藏
myChart.hideLoading();
},
error: function (data) {
console.log(data);
LiKeScores = data.LiKe;
WenKeScores = data.WenKe;
//Loading(false);
}
});
</script>using System;
using System.Collections.Generic;
using System.Linq;
using System.Web;
using System.Web.Mvc;
namespace EchartDemo.Controllers
{
public class DefaultController : Controller
    {
        // GET: Default
        public ActionResult BarEcharts()
        {
            return View();
        }

        public ContentResult GetScoresJson()
        {
            //这里只是模拟数据,正式环境需要到db中查询
            return Content("{LiKe:[10, 20, 30, 100, 300, 80, 60],WenKe:[15, 10, 30, 80, 400, 100, 60]}");
        }
    }
}The above is the detailed content of What are the UI frameworks based on bootstrap?. For more information, please follow other related articles on the PHP Chinese website!

Hot AI Tools

Undresser.AI Undress
AI-powered app for creating realistic nude photos

AI Clothes Remover
Online AI tool for removing clothes from photos.

Undress AI Tool
Undress images for free

Clothoff.io
AI clothes remover

Video Face Swap
Swap faces in any video effortlessly with our completely free AI face swap tool!

Hot Article

Hot Tools

Notepad++7.3.1
Easy-to-use and free code editor

SublimeText3 Chinese version
Chinese version, very easy to use

Zend Studio 13.0.1
Powerful PHP integrated development environment

Dreamweaver CS6
Visual web development tools

SublimeText3 Mac version
God-level code editing software (SublimeText3)

Hot Topics
 1386
1386
 52
52
 How to get the bootstrap search bar
Apr 07, 2025 pm 03:33 PM
How to use Bootstrap to get the value of the search bar: Determines the ID or name of the search bar. Use JavaScript to get DOM elements. Gets the value of the element. Perform the required actions.
 How to use bootstrap in vue
Apr 07, 2025 pm 11:33 PM
Using Bootstrap in Vue.js is divided into five steps: Install Bootstrap. Import Bootstrap in main.js. Use the Bootstrap component directly in the template. Optional: Custom style. Optional: Use plug-ins.
 How to write split lines on bootstrap
Apr 07, 2025 pm 03:12 PM
There are two ways to create a Bootstrap split line: using the tag, which creates a horizontal split line. Use the CSS border property to create custom style split lines.
 How to do vertical centering of bootstrap
Apr 07, 2025 pm 03:21 PM
Use Bootstrap to implement vertical centering: flexbox method: Use the d-flex, justify-content-center, and align-items-center classes to place elements in the flexbox container. align-items-center class method: For browsers that do not support flexbox, use the align-items-center class, provided that the parent element has a defined height.
 How to set up the framework for bootstrap
Apr 07, 2025 pm 03:27 PM
To set up the Bootstrap framework, you need to follow these steps: 1. Reference the Bootstrap file via CDN; 2. Download and host the file on your own server; 3. Include the Bootstrap file in HTML; 4. Compile Sass/Less as needed; 5. Import a custom file (optional). Once setup is complete, you can use Bootstrap's grid systems, components, and styles to create responsive websites and applications.
 How to insert pictures on bootstrap
Apr 07, 2025 pm 03:30 PM
There are several ways to insert images in Bootstrap: insert images directly, using the HTML img tag. With the Bootstrap image component, you can provide responsive images and more styles. Set the image size, use the img-fluid class to make the image adaptable. Set the border, using the img-bordered class. Set the rounded corners and use the img-rounded class. Set the shadow, use the shadow class. Resize and position the image, using CSS style. Using the background image, use the background-image CSS property.
 How to resize bootstrap
Apr 07, 2025 pm 03:18 PM
To adjust the size of elements in Bootstrap, you can use the dimension class, which includes: adjusting width: .col-, .w-, .mw-adjust height: .h-, .min-h-, .max-h-
 How to use bootstrap button
Apr 07, 2025 pm 03:09 PM
How to use the Bootstrap button? Introduce Bootstrap CSS to create button elements and add Bootstrap button class to add button text


