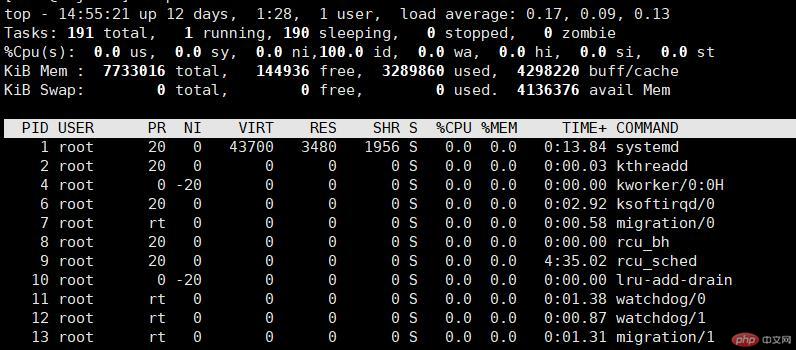
The top command under Linux can be used to monitor the health of the server in real time. This command can obtain a lot of information and is one of the best helpers for server operation and maintenance engineers. We know that the ps command can monitor the running status of each process on the server at a certain moment. Compared with ps, the top command can continuously monitor.
top [选项]
Commonly used options are as follows:
-d Screen refresh interval, the default is 5 seconds
-n Total refresh Number of screens
-u Specify user name
-p Specify process ID
below , let’s take a look at the information generated by the top command

First let’s look at the first line
top - 14:55:21 represents the current system time
up 12 days, 1:28 represents the time the server has been running since the last startup
1 user How many users have logged in to the current system
load average: 0.17, 0.09, 0.13 Indicates the workload of the system in the past 1 minute, 5 minutes, and 15 minutes. Load indicates that the system is running several programs at the same time. For a single-core CPU, if the load is less than 1, it is normal. If there are 4 CPUs and they are all two cores, then the load is less than 8, which is normal.
Continue to look at the second line. The second line gives the overall information of all processes in the system. There are 191 processes in total, 1 process is running, and 190 processes are sleeping. .
The third line displays cpu usage information
us represents the percentage of cpu occupied by the user process. If it is multi-core, this represents the average value. You can press 1 to Shows usage of each cpu.
sy represents the percentage of cpu occupied by kernel space
id represents the percentage of idle time in cpu
wa represents I/0 wait, which is the percentage of CPU time waiting for input and output.
The fourth and fifth lines show the memory usage and swap space usage respectively.
For the top command, we not only need to know the meaning of several options, but also some interactive commands. These interactive commands allow us to query the information we want very conveniently. Two commonly used interactive commands are as follows:
P: Sort based on CPU usage percentage;
M: Sort based on resident memory size Sorting
c: Switch to display the command name and complete command line
After introducing the top command, here is a very important step in daily operation and maintenance: Useful little method. When we know that a certain process consumes more resources, we may need to monitor this process for a period of time. If it continues to consume resources, we need to take corresponding measures. For example, we know that the mysql process consumes more resources and its pid is 1992, then we use top to monitor the process for a while.
top -p 1992
The above is the detailed content of Comprehensive explanation of the top command under Linux - real-time monitoring of server status. For more information, please follow other related articles on the PHP Chinese website!