

How to install react in code

在code中安装react的方法:首先安装好vscode;然后使用npm安装“create-react-app”;接着通过“create-react-app my-app”命令创建一个React项目;最后运行npm start进行检测即可。

推荐:《js视频教程》
visual studio code + react 开发环境搭建
开发环境 windows
开发工具 visual studio code
node 安装和 npm
windows 安装node 可以直接在 node官网 直接下载直接当作普通软件安装即可。
安装完成可以在控制台中运行node测试是否安装成功 win + r 输入 cmd ,直接在终端输入node -v 输出版本号及已经成功安装。
目前新版本的node自带npm(npm 是随同 node 一起安装的包管理工具)。这里安装好了 node并且测试安装成功之后,可以继续在控制台输入 npm -v 检查是不是安装成功。同样成功会输出版本号。
安装 visual studio code
vs code 正常软件安装 没有需要注意的,直接下载安装(https://code.visualstudio.com/)
安装React
参照文档 React JavaScript Tutorial in VS Code (https://code.visualstudio.com/docs/nodejs/reactjs-tutorial)文档已经很详细 按照文档来一遍就基本上没问题。
- 创建本地文件夹,即保存项目的文件夹,在文件夹下打开控制台我这里使用git bash直接在文件夹下右键找到git bash启动即可
- 在控制台输入
npm install -g create-react-app使用npm安装 create-react-app - 安装完 create-react-app 之后 继续输入
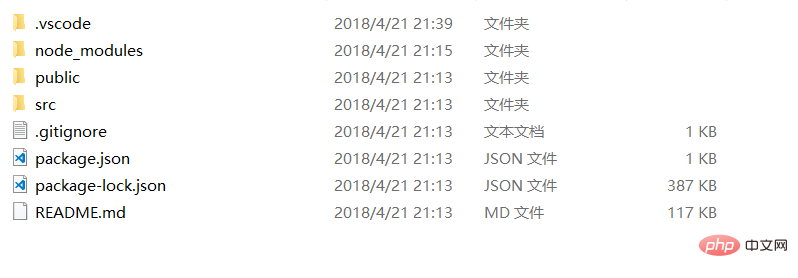
create-react-app my-app来创建一个项目my-app是创建出来的 React 项目,等待一段时间(这里需要下载一些依赖包),即可看到创建完成的整个文件结构
- 切换控制台目录到项目目录下 运行
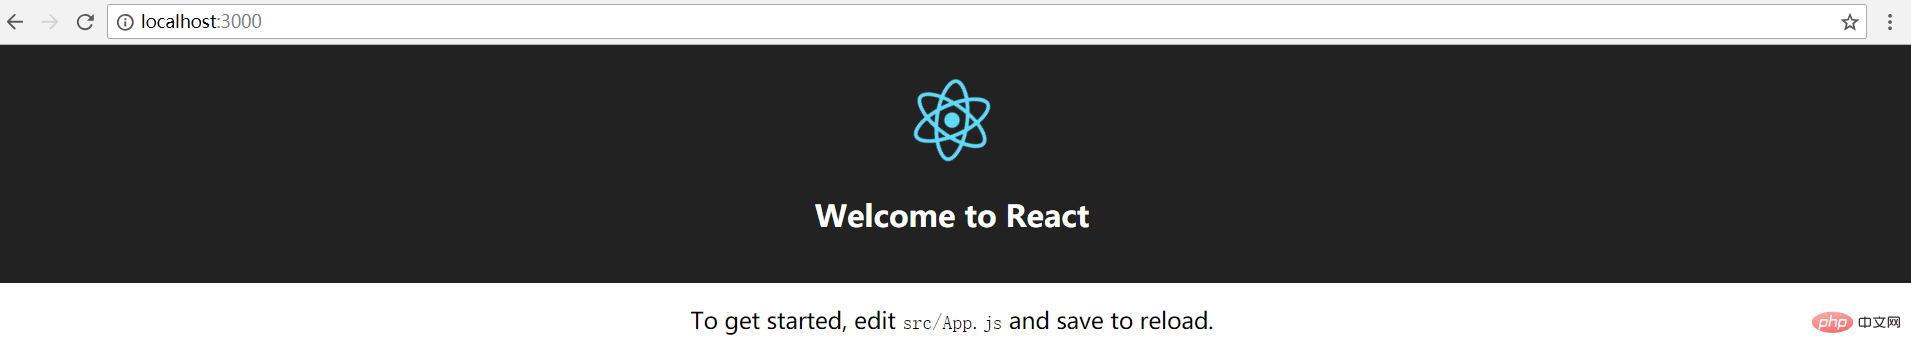
npm start检测当前项目是否创建成功 正常情况下当输入命令之后 会直接打开默认浏览器预览 http://localhost:3000/ 此时会看到一个react的页面
至此新建的React项目已经可以正常运行了
5.用VS Code 打开项目文件夹,这里可以看到整个文件结构
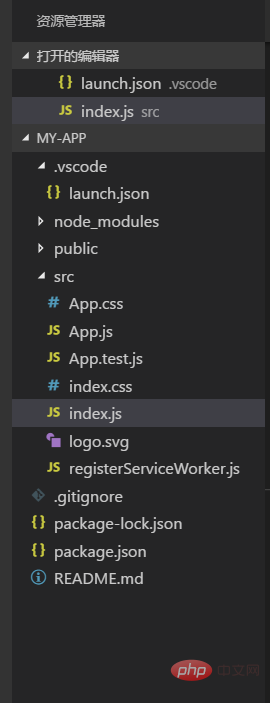
所有文件都可以直接使用VS Code直接修改。
安装 Debugger for Chrome
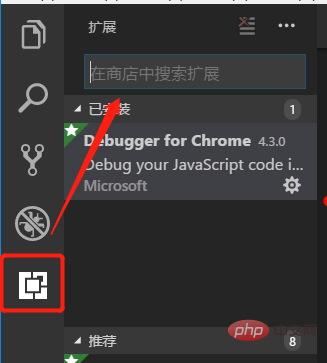
- VS Code 提供 Debugger for Chrome 插件 可以支持使用chrome内核debug。
直接搜索 安装 之后重新加载一次VS Code
2.使用Debugger for Chrome 进行debug 需要对项目进行额外的配置
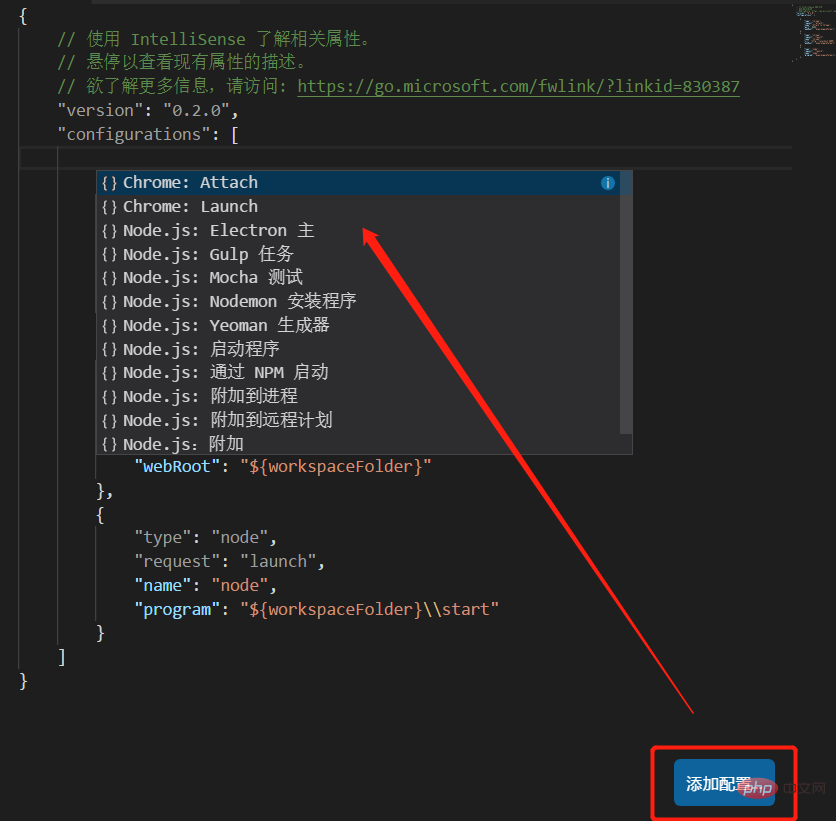
在此处设置启动配置,文档原文中所说的会创建一个新的launch.json,我这里已经存在一个launch.json文件则直接在里面添加配置即可,这里有一个添加配置的按钮可以直接添加配置节点 ,注意这里有两个chrome相关节点一个Launch 一个 Attach
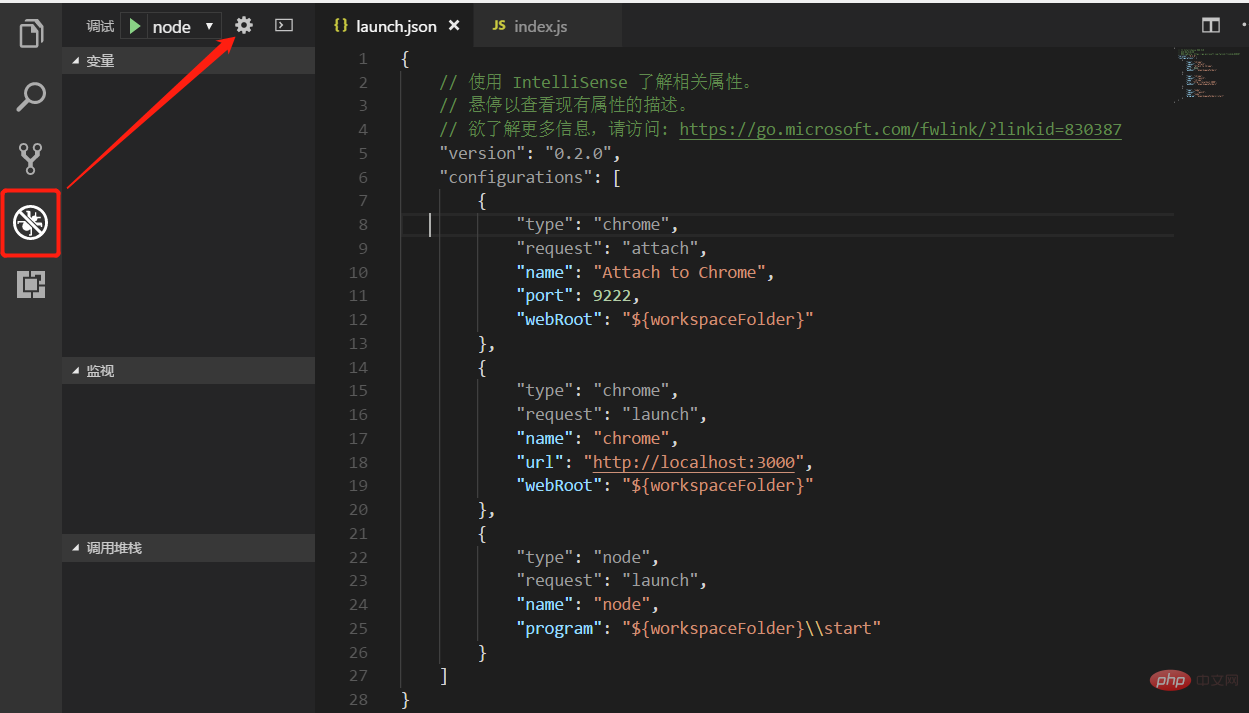
创建完两个节点 之后 找到 "request": "launch" 的一个节点里面有一个url将这个url设置为之前 React 项目启动的url,即 http://localhost:3000/ 另一个配置节点默认即可如有问题再做修改,修改后的全部配置如下:
{
    // 使用 IntelliSense 了解相关属性。
    // 悬停以查看现有属性的描述。
    // 欲了解更多信息,请访问: https://go.microsoft.com/fwlink/?linkid=830387
    "version": "0.2.0",
    "configurations": [
        {
            "type": "chrome",
            "request": "attach",
            "name": "Attach to Chrome",
            "port": 9222,
            "webRoot": "${workspaceFolder}"
        },
        {
            "type": "chrome",
            "request": "launch",
            "name": "chrome",
            "url": "http://localhost:3000",
            "webRoot": "${workspaceFolder}"
        },
        {
            "type": "node",
            "request": "launch",
            "name": "node",
            "program": "${workspaceFolder}\\start"
        }
]}启动项目
npm start然后打开debug工具栏
选择之前添加的 chrome 节点启动 ,此时会打开一个新的chrome页面Find the
index.jsfile in the project source code, put a breakpoint, left-click in front of the line number, and then refresh the page, you can enter the endpoint
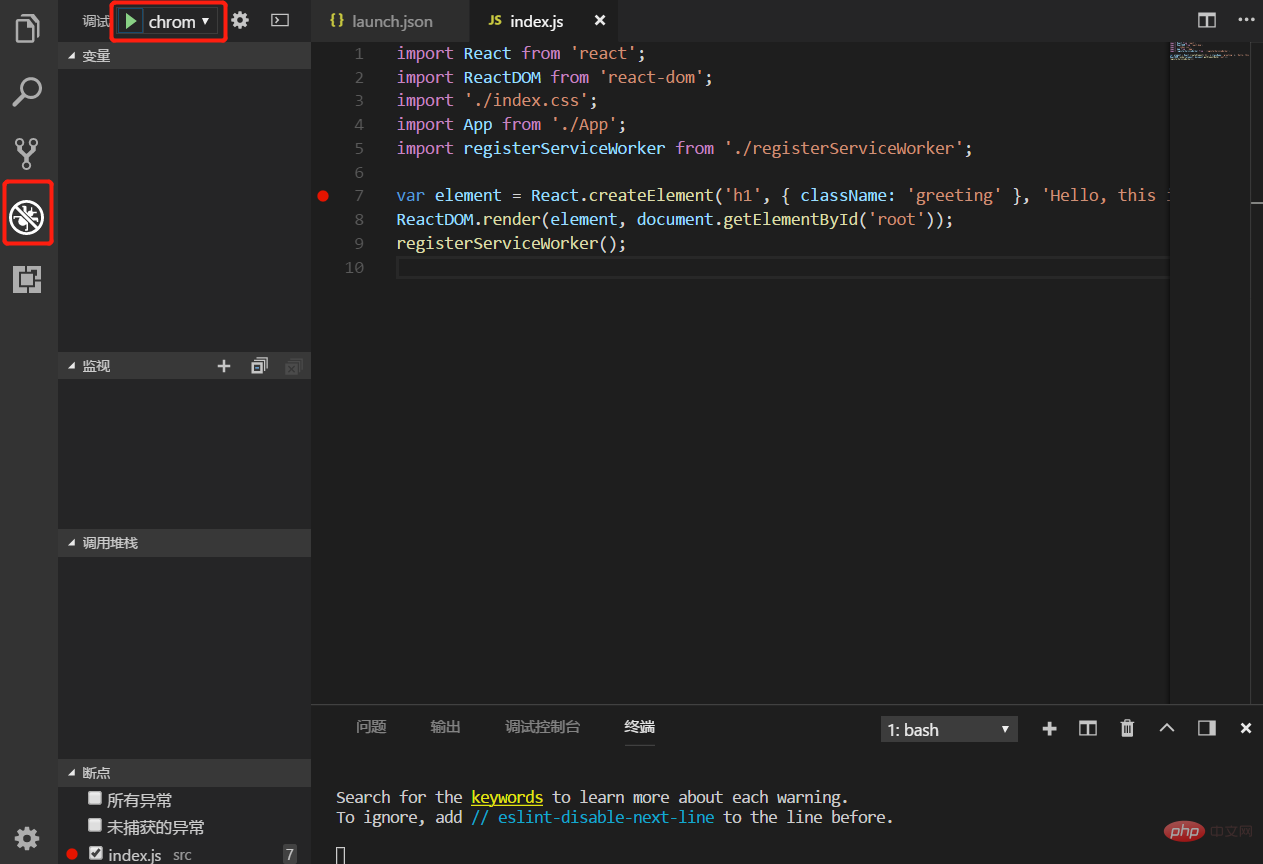
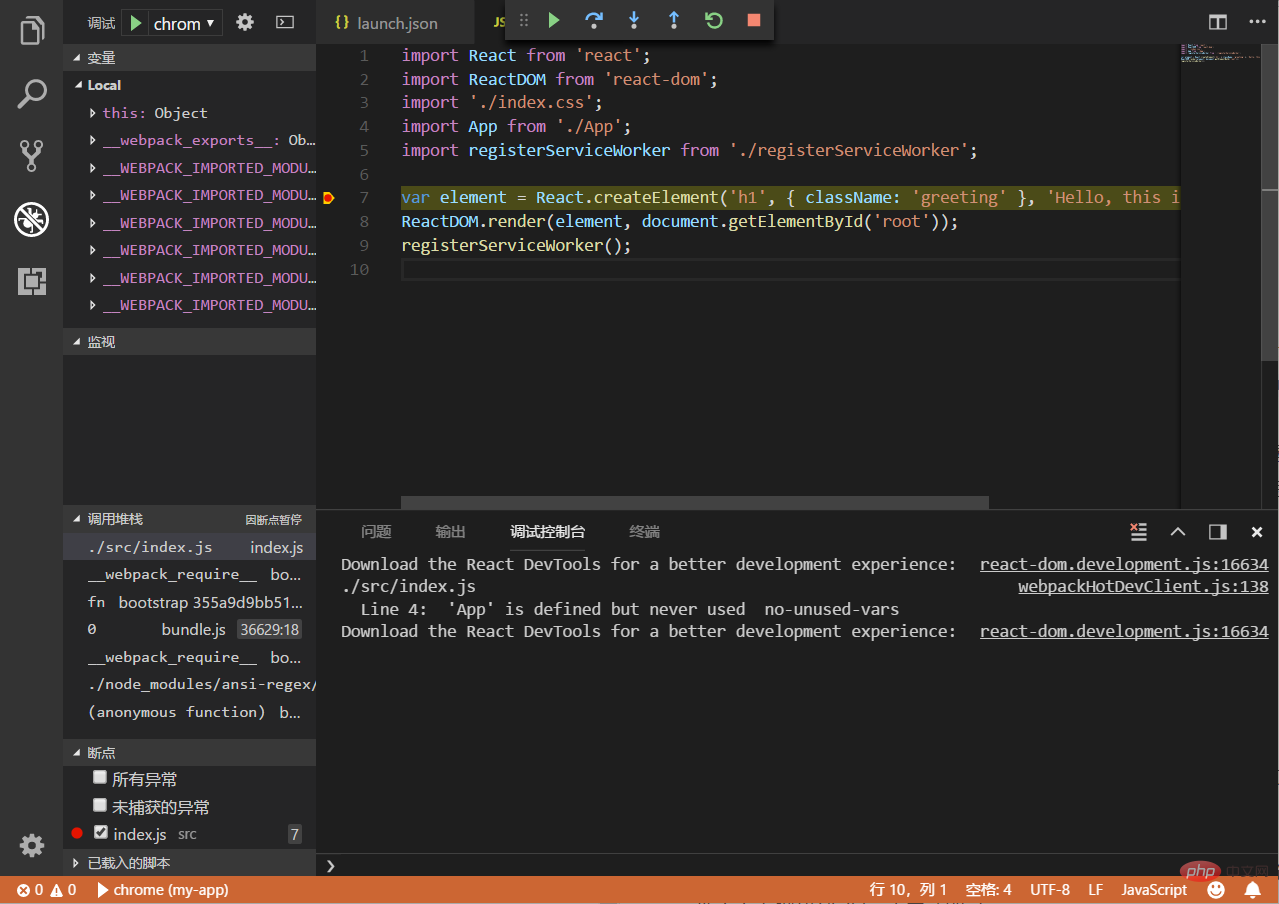
Now you can simply debug.
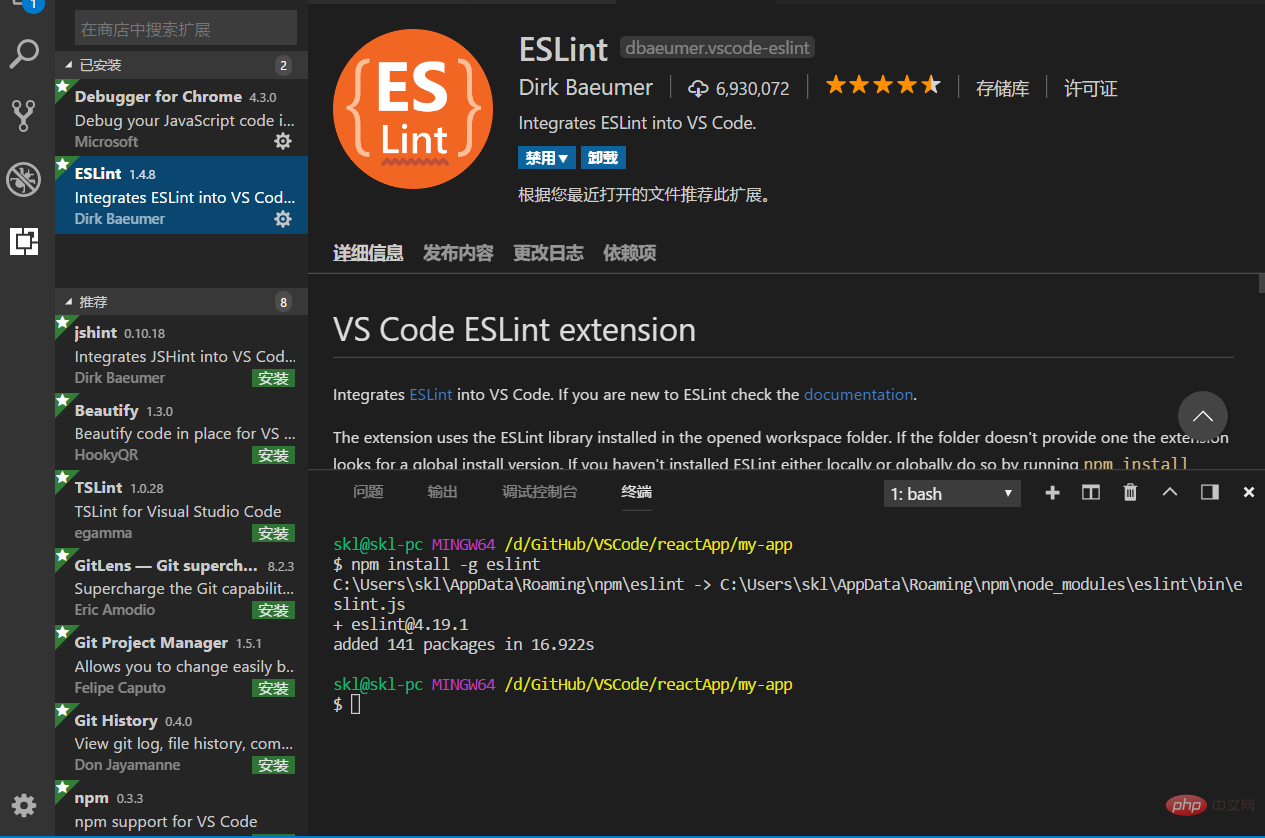
Install eslint
eslint is a compilable JavaScript and JSX inspection tool. Can be used to check specification code for syntax errors.
- Enter in the console
npm install -g eslintInstall eslint - Install the eslint plug-in through VS Code
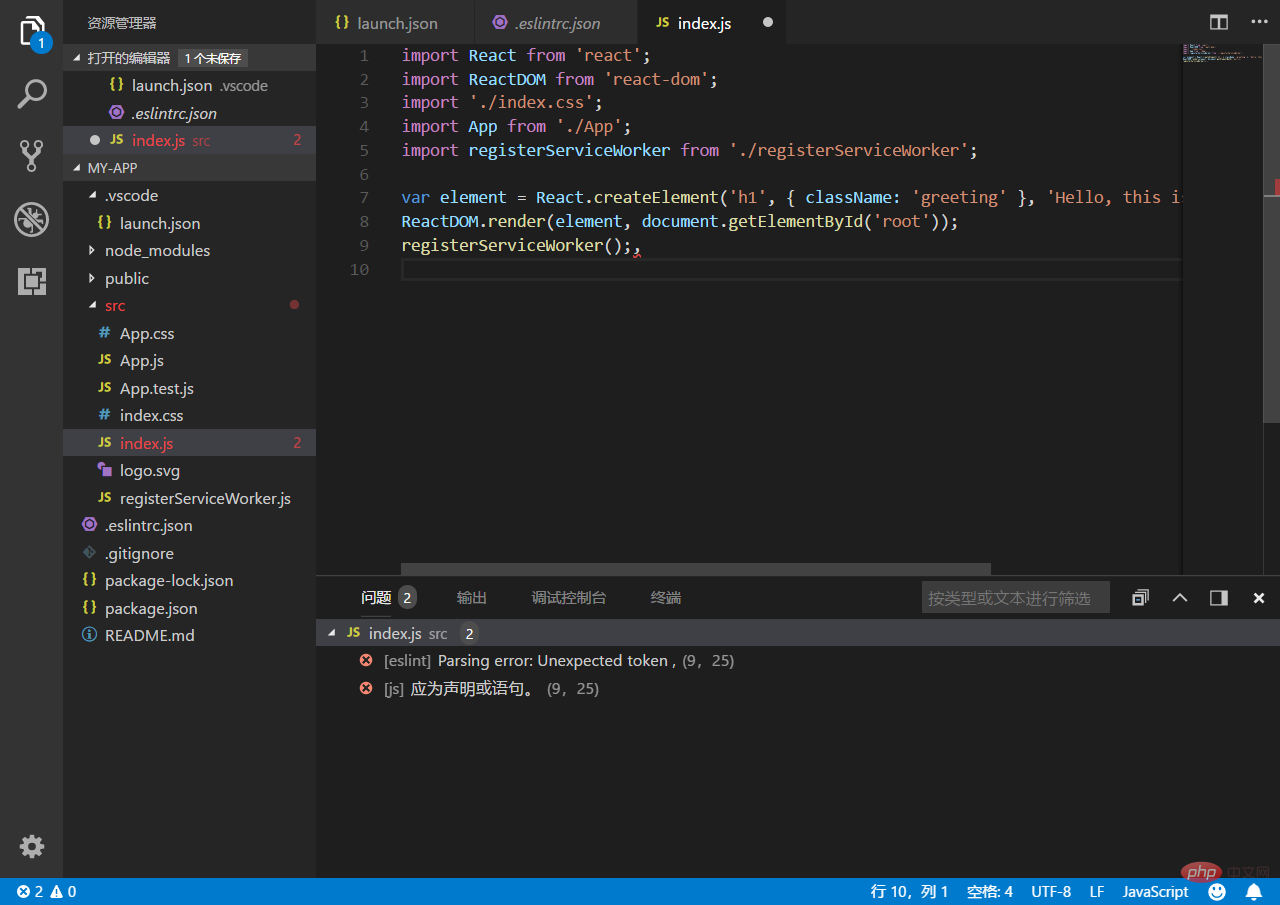
- Open the command panel of VS Code and find it directly in the view or
Ctrl Shift PEnter ESLint to find the option to create the.eslintrc.jsonfile. At this time, a configuration file will be created in the project root directory. At this time, some grammatical errors in your project will be automatically detected
#There are also rules for configuring semicolons in the reference document, you can add them if needed.
The above is the detailed content of How to install react in code. For more information, please follow other related articles on the PHP Chinese website!

Hot AI Tools

Undresser.AI Undress
AI-powered app for creating realistic nude photos

AI Clothes Remover
Online AI tool for removing clothes from photos.

Undress AI Tool
Undress images for free

Clothoff.io
AI clothes remover

AI Hentai Generator
Generate AI Hentai for free.

Hot Article
Hot Tools

Notepad++7.3.1
Easy-to-use and free code editor

SublimeText3 Chinese version
Chinese version, very easy to use

Zend Studio 13.0.1
Powerful PHP integrated development environment

Dreamweaver CS6
Visual web development tools

SublimeText3 Mac version
God-level code editing software (SublimeText3)
Hot Topics
 1378
1378
 52
52

 How do I create and publish my own JavaScript libraries?
Mar 18, 2025 pm 03:12 PM
How do I create and publish my own JavaScript libraries?
Mar 18, 2025 pm 03:12 PM
Article discusses creating, publishing, and maintaining JavaScript libraries, focusing on planning, development, testing, documentation, and promotion strategies.
 How do I optimize JavaScript code for performance in the browser?
Mar 18, 2025 pm 03:14 PM
How do I optimize JavaScript code for performance in the browser?
Mar 18, 2025 pm 03:14 PM
The article discusses strategies for optimizing JavaScript performance in browsers, focusing on reducing execution time and minimizing impact on page load speed.
 What should I do if I encounter garbled code printing for front-end thermal paper receipts?
Apr 04, 2025 pm 02:42 PM
What should I do if I encounter garbled code printing for front-end thermal paper receipts?
Apr 04, 2025 pm 02:42 PM
Frequently Asked Questions and Solutions for Front-end Thermal Paper Ticket Printing In Front-end Development, Ticket Printing is a common requirement. However, many developers are implementing...
 How do I debug JavaScript code effectively using browser developer tools?
Mar 18, 2025 pm 03:16 PM
How do I debug JavaScript code effectively using browser developer tools?
Mar 18, 2025 pm 03:16 PM
The article discusses effective JavaScript debugging using browser developer tools, focusing on setting breakpoints, using the console, and analyzing performance.
 Who gets paid more Python or JavaScript?
Apr 04, 2025 am 12:09 AM
Who gets paid more Python or JavaScript?
Apr 04, 2025 am 12:09 AM
There is no absolute salary for Python and JavaScript developers, depending on skills and industry needs. 1. Python may be paid more in data science and machine learning. 2. JavaScript has great demand in front-end and full-stack development, and its salary is also considerable. 3. Influencing factors include experience, geographical location, company size and specific skills.
 How do I use source maps to debug minified JavaScript code?
Mar 18, 2025 pm 03:17 PM
How do I use source maps to debug minified JavaScript code?
Mar 18, 2025 pm 03:17 PM
The article explains how to use source maps to debug minified JavaScript by mapping it back to the original code. It discusses enabling source maps, setting breakpoints, and using tools like Chrome DevTools and Webpack.
 Getting Started With Chart.js: Pie, Doughnut, and Bubble Charts
Mar 15, 2025 am 09:19 AM
Getting Started With Chart.js: Pie, Doughnut, and Bubble Charts
Mar 15, 2025 am 09:19 AM
This tutorial will explain how to create pie, ring, and bubble charts using Chart.js. Previously, we have learned four chart types of Chart.js: line chart and bar chart (tutorial 2), as well as radar chart and polar region chart (tutorial 3). Create pie and ring charts Pie charts and ring charts are ideal for showing the proportions of a whole that is divided into different parts. For example, a pie chart can be used to show the percentage of male lions, female lions and young lions in a safari, or the percentage of votes that different candidates receive in the election. Pie charts are only suitable for comparing single parameters or datasets. It should be noted that the pie chart cannot draw entities with zero value because the angle of the fan in the pie chart depends on the numerical size of the data point. This means any entity with zero proportion
 The difference in console.log output result: Why are the two calls different?
Apr 04, 2025 pm 05:12 PM
The difference in console.log output result: Why are the two calls different?
Apr 04, 2025 pm 05:12 PM
In-depth discussion of the root causes of the difference in console.log output. This article will analyze the differences in the output results of console.log function in a piece of code and explain the reasons behind it. �...
