Detailed explanation of garbage collection and memory leaks in JS

The program requires memory to run. Whenever a program asks for it, the operating system or runtime must provide memory. The so-called memory leak is simply memory that is no longer used and is not released in time. In order to better avoid memory leaks, we first introduce the Javascript garbage collection mechanism.
In languages such as C and C, developers can directly control the application and recycling of memory. However, in Java, C#, and JavaScript languages, the application and release of memory space for variables are handled by the program itself, and developers do not need to care. In other words, Javascript has an automatic garbage collection mechanism (Garbage Collection).
1. The necessity of garbage collection
The following passage is quoted from "The Definitive Guide to JavaScript (Fourth Edition)"
Since strings, objects and arrays are not fixed size, so when their sizes are known, dynamic storage allocation can be performed on them. Every time a JavaScript program creates a string, array, or object, the interpreter must allocate memory to store that entity. Whenever memory is allocated dynamically like this, it must eventually be freed so that it can be reused, otherwise the JavaScript interpreter will consume all available memory in the system, causing the system to crash.

This passage explains why the system needs garbage collection. JavaScript is not like C/C, it has its own garbage collection mechanism.
The mechanism of JavaScript garbage collection is very simple: find the variables that are no longer used, and then release the memory they occupy. However, this process is not time-consuming because its overhead is relatively large, so the garbage collector will follow a fixed Periodically executed at intervals.
var a = "浪里行舟";
var b = "前端工匠";
var a = b; //重写a
After this code is run, the string "Wanglizhou" loses its reference (it was previously referenced by a). After the system detects this fact, it will release the storage space of the string so that These spaces can be reused.
2. Garbage collection mechanism
How does the garbage collection mechanism know which memory is no longer needed?
There are two methods of garbage collection: mark clearing and reference counting. Reference counting is less commonly used, mark-and-sweep is more commonly used.
1. Mark clearing
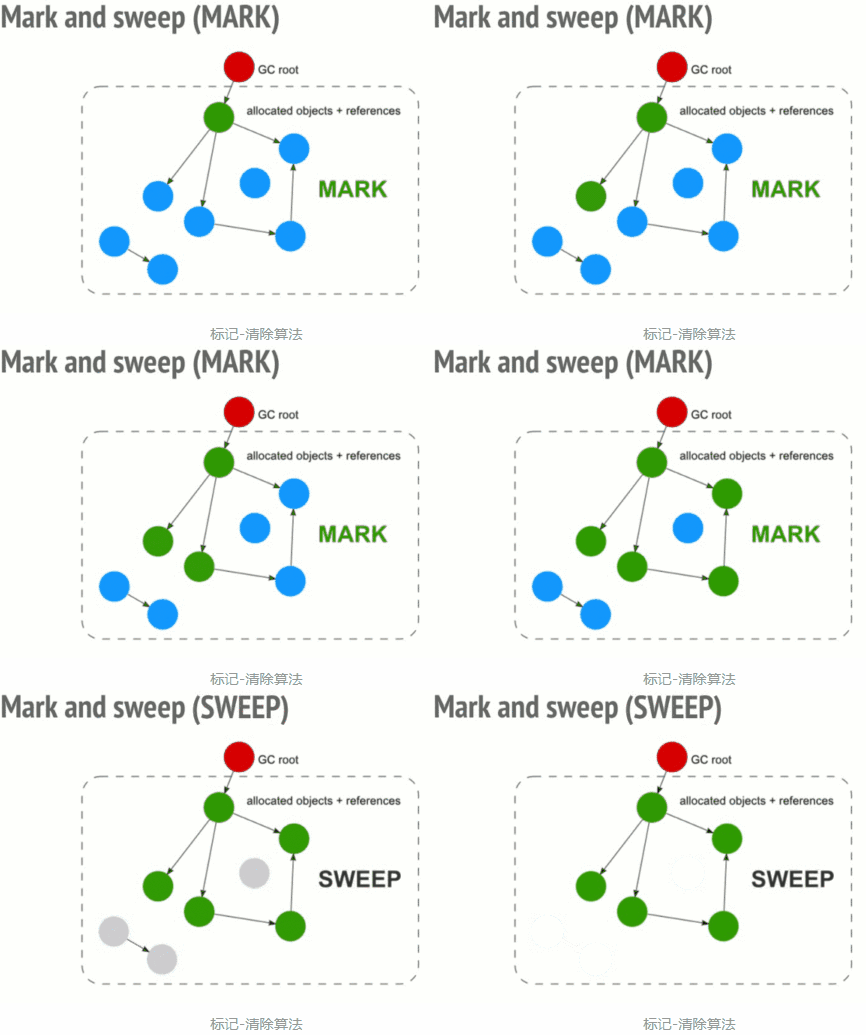
This is the most commonly used garbage collection method in javascript. When a variable enters the execution environment, mark the variable as "entering the environment". Logically speaking, the memory occupied by variables entering the environment can never be released, because they may be used as long as the execution flow enters the corresponding environment. When a variable leaves the environment, it is marked as "leaving the environment".
The garbage collector will mark all variables stored in memory when it runs. Then, it removes the variables in the environment and the tags referenced by the variables in the environment. Variables that are marked after this will be regarded as variables to be deleted because variables in the environment can no longer access these variables. at last. The garbage collector completes the memory cleaning work, destroys those marked values, and reclaims the memory space they occupy.

Let’s use an example to explain this method:
var m = 0,n = 19 // 把 m,n,add() 标记为进入环境。
add(m, n) // 把 a, b, c标记为进入环境。
console.log(n) // a,b,c标记为离开环境,等待垃圾回收。
function add(a, b) {
  a++
  var c = a + b
  return c
}2. Reference counting
The so-called "reference counting" refers to language The engine has a "reference table" that saves the number of references to all resources (usually various values) in the memory. If the number of references to a value is 0, it means that the value is no longer used, so the memory can be released.
In the above picture, the two values in the lower left corner have no references, so they can be released.
If a value is no longer needed but the reference number is not 0, the garbage collection mechanism cannot release this memory, resulting in a memory leak.
var arr = [1, 2, 3, 4];
arr = [2, 4, 5]
console.log('浪里行舟');
In the above code, the array [1, 2, 3, 4] is a value and will occupy memory. The variable arr is the only reference to this value, so the number of references is 1. Although arr is not used in the following code, it will continue to occupy memory. As for how to release memory, we will introduce it below.
In the third line of code, the variable arr referenced by array [1, 2, 3, 4] obtains another value, then the number of references to array [1, 2, 3, 4] is reduced by 1 , at this time its reference count becomes 0, which means that there is no way to access this value anymore, so the memory space it occupies can be recovered.
But the biggest problem with reference counting is: circular reference
function func() {
    let obj1 = {};
    let obj2 = {};

    obj1.a = obj2; // obj1 引用 obj2
    obj2.a = obj1; // obj2 引用 obj1
}When the function func is executed, the return value is undefined, so the entire function and internal variables should be recycled, but according to Reference counting method, the number of references of obj1 and obj2 is not 0, so they will not be recycled.
To solve the problem of circular references, it is best to manually set them to empty when they are not used. The above example can be done like this:
obj1 = null;
obj2 = null;
三、哪些情况会引起内存泄漏?
虽然JavaScript会自动垃圾收集,但是如果我们的代码写法不当,会让变量一直处于“进入环境”的状态,无法被回收。下面列一下内存泄漏常见的几种情况:
1. 意外的全局变量
function foo(arg) {
    bar = "this is a hidden global variable";
}bar没被声明,会变成一个全局变量,在页面关闭之前不会被释放。
另一种意外的全局变量可能由 this 创建:
function foo() {
    this.variable = "potential accidental global";
}
// foo 调用自己,this 指向了全局对象(window)
foo();在 JavaScript 文件头部加上 'use strict',可以避免此类错误发生。启用严格模式解析 JavaScript ,避免意外的全局变量。
2. 被遗忘的计时器或回调函数
var someResource = getData();
setInterval(function() {
    var node = document.getElementById('Node');
    if(node) {
        // 处理 node 和 someResource
        node.innerHTML = JSON.stringify(someResource));
    }
}, 1000);这样的代码很常见,如果id为Node的元素从DOM中移除,该定时器仍会存在,同时,因为回调函数中包含对someResource的引用,定时器外面的someResource也不会被释放。
3. 闭包
function bindEvent(){
  var obj=document.createElement('xxx')
  obj.onclick=function(){
    // Even if it is a empty function
  }
}闭包可以维持函数内局部变量,使其得不到释放。上例定义事件回调时,由于是函数内定义函数,并且内部函数--事件回调引用外部函数,形成了闭包。
// 将事件处理函数定义在外面
function bindEvent() {
  var obj = document.createElement('xxx')
  obj.onclick = onclickHandler
}
// 或者在定义事件处理函数的外部函数中,删除对dom的引用
function bindEvent() {
  var obj = document.createElement('xxx')
  obj.onclick = function() {
    // Even if it is a empty function
  }
  obj = null
}解决之道,将事件处理函数定义在外部,解除闭包,或者在定义事件处理函数的外部函数中,删除对dom的引用。
4. 没有清理的DOM元素引用
有时,保存 DOM 节点内部数据结构很有用。假如你想快速更新表格的几行内容,把每一行 DOM 存成字典(JSON 键值对)或者数组很有意义。此时,同样的 DOM 元素存在两个引用:一个在 DOM 树中,另一个在字典中。将来你决定删除这些行时,需要把两个引用都清除。
var elements = {
    button: document.getElementById('button'),
    image: document.getElementById('image'),
    text: document.getElementById('text')
};
function doStuff() {
    image.src = 'http://some.url/image';
    button.click();
    console.log(text.innerHTML);
}
function removeButton() {
    document.body.removeChild(document.getElementById('button'));
    // 此时,仍旧存在一个全局的 #button 的引用
    // elements 字典。button 元素仍旧在内存中,不能被 GC 回收。
}虽然我们用removeChild移除了button,但是还在elements对象里保存着#button的引用,换言之,DOM元素还在内存里面。
四、内存泄漏的识别方法
新版本的chrome在 performance 中查看:
步骤:
- 打开开发者工具 Performance
- 勾选 Screenshots 和 memory
- 左上角小圆点开始录制(record)
- 停止录制
图中 Heap 对应的部分就可以看到内存在周期性的回落也可以看到垃圾回收的周期,如果垃圾回收之后的最低值(我们称为min),min在不断上涨,那么肯定是有较为严重的内存泄漏问题。
避免内存泄漏的一些方式:
- 减少不必要的全局变量,或者生命周期较长的对象,及时对无用的数据进行垃圾回收
- 注意程序逻辑,避免“死循环”之类的
- 避免创建过多的对象
总而言之需要遵循一条原则:不用了的东西要及时归还
五、垃圾回收的使用场景优化
1. 数组array优化
将[]赋值给一个数组对象,是清空数组的捷径(例如: arr = [];),但是需要注意的是,这种方式又创建了一个新的空对象,并且将原来的数组对象变成了一小片内存垃圾!实际上,将数组长度赋值为0(arr.length = 0)也能达到清空数组的目的,并且同时能实现数组重用,减少内存垃圾的产生。
const arr = [1, 2, 3, 4];
console.log('浪里行舟');
arr.length = 0  // 可以直接让数字清空,而且数组类型不变。
// arr = []; 虽然让a变量成一个空数组,但是在堆上重新申请了一个空数组对象。
2. 对象尽量复用
对象尽量复用,尤其是在循环等地方出现创建新对象,能复用就复用。不用的对象,尽可能设置为null,尽快被垃圾回收掉。
var t = {} // 每次循环都会创建一个新对象。
for (var i = 0; i < 10; i++) {
// var t = {};// 每次循环都会创建一个新对象。
t.age = 19
t.name = '123'
t.index = i
console.log(t)
}
t = null //对象如果已经不用了,那就立即设置为null;等待垃圾回收。3. 在循环中的函数表达式,能复用最好放到循环外面。
// 在循环中最好也别使用函数表达式。
for (var k = 0; k < 10; k++) {
  var t = function(a) {
    // 创建了10次  函数对象。
    console.log(a)
  }
  t(k)
}// 推荐用法
function t(a) {
console.log(a)
}
for (var k = 0; k < 10; k++) {
t(k)
}
t = null参考资料
- JavaScript高级内幕(js高级)
- JavaScript垃圾回收机制
- JavaScript 内存泄漏教程
- JavaScript权威指南(第四版)
- JavaScript 中的垃圾回收
- 4类 JavaScript 内存泄漏及如何避免
作者:浪里行舟
更多编程相关知识,请访问:编程学习网站!!
The above is the detailed content of Detailed explanation of garbage collection and memory leaks in JS. For more information, please follow other related articles on the PHP Chinese website!

Hot AI Tools

Undresser.AI Undress
AI-powered app for creating realistic nude photos

AI Clothes Remover
Online AI tool for removing clothes from photos.

Undress AI Tool
Undress images for free

Clothoff.io
AI clothes remover

AI Hentai Generator
Generate AI Hentai for free.

Hot Article

Hot Tools

Notepad++7.3.1
Easy-to-use and free code editor

SublimeText3 Chinese version
Chinese version, very easy to use

Zend Studio 13.0.1
Powerful PHP integrated development environment

Dreamweaver CS6
Visual web development tools

SublimeText3 Mac version
God-level code editing software (SublimeText3)

Hot Topics
 1377
1377
 52
52
 Go memory leak tracking: Go pprof practical guide
Apr 08, 2024 am 10:57 AM
The pprof tool can be used to analyze the memory usage of Go applications and detect memory leaks. It provides memory profile generation, memory leak identification and real-time analysis capabilities. Generate a memory snapshot by using pprof.Parse and identify the data structures with the most memory allocations using the pprof-allocspace command. At the same time, pprof supports real-time analysis and provides endpoints to remotely access memory usage information.
 What is the relationship between memory management techniques and security in Java functions?
May 02, 2024 pm 01:06 PM
Memory management in Java involves automatic memory management, using garbage collection and reference counting to allocate, use and reclaim memory. Effective memory management is crucial for security because it prevents buffer overflows, wild pointers, and memory leaks, thereby improving the safety of your program. For example, by properly releasing objects that are no longer needed, you can avoid memory leaks, thereby improving program performance and preventing crashes.
 Solve the memory leak problem caused by closures
Feb 18, 2024 pm 03:20 PM
Title: Memory leaks caused by closures and solutions Introduction: Closures are a very common concept in JavaScript, which allow internal functions to access variables of external functions. However, closures can cause memory leaks if used incorrectly. This article will explore the memory leak problem caused by closures and provide solutions and specific code examples. 1. Memory leaks caused by closures The characteristic of closures is that internal functions can access variables of external functions, which means that variables referenced in closures will not be garbage collected. If used improperly,
 How to avoid memory leaks in Golang technical performance optimization?
Jun 04, 2024 pm 12:27 PM
Memory leaks can cause Go program memory to continuously increase by: closing resources that are no longer in use, such as files, network connections, and database connections. Use weak references to prevent memory leaks and target objects for garbage collection when they are no longer strongly referenced. Using go coroutine, the coroutine stack memory will be automatically released when exiting to avoid memory leaks.
 How to detect memory leaks using Valgrind?
Jun 05, 2024 am 11:53 AM
Valgrind detects memory leaks and errors by simulating memory allocation and deallocation. To use it, follow these steps: Install Valgrind: Download and install the version for your operating system from the official website. Compile the program: Compile the program using Valgrind flags (such as gcc-g-omyprogrammyprogram.c-lstdc++). Analyze the program: Use the valgrind--leak-check=fullmyprogram command to analyze the compiled program. Check the output: Valgrind will generate a report after the program execution, showing memory leaks and error messages.
 Debugging techniques for memory leaks in C++
Jun 05, 2024 pm 10:19 PM
A memory leak in C++ means that the program allocates memory but forgets to release it, causing the memory to not be reused. Debugging techniques include using debuggers (such as Valgrind, GDB), inserting assertions, and using memory leak detector libraries (such as Boost.LeakDetector, MemorySanitizer). It demonstrates the use of Valgrind to detect memory leaks through practical cases, and proposes best practices to avoid memory leaks, including: always releasing allocated memory, using smart pointers, using memory management libraries, and performing regular memory checks.
 How to effectively avoid memory leaks in closures?
Jan 13, 2024 pm 12:46 PM
How to prevent memory leaks in closures? Closure is one of the most powerful features in JavaScript, which enables nesting of functions and encapsulation of data. However, closures are also prone to memory leaks, especially when dealing with asynchronous and timers. This article explains how to prevent memory leaks in closures and provides specific code examples. Memory leaks usually occur when an object is no longer needed but the memory it occupies cannot be released for some reason. In a closure, when a function refers to external variables, and these variables
 Python CPython performance optimization tips
Mar 06, 2024 pm 06:04 PM
Python is widely used in various fields and is highly regarded for its ease of use and powerful functions. However, its performance can become a bottleneck in some cases. Through an in-depth understanding of the CPython virtual machine and some clever optimization techniques, the running efficiency of Python programs can be significantly improved. 1. Understand the CPython virtual machine CPython is the most popular implementation of Python, which uses a virtual machine (VM) to execute Python code. The VM interprets the bytecode into machine instructions, which will cause a certain amount of time overhead. Understanding how VMs work helps us identify and optimize performance bottlenecks. 2. Garbage collection Python uses a reference counting mechanism for garbage collection, but it may cause periodic garbage collection pauses


