
How to view CSS code in chrome developer tools: first open the debugging tool and click the inspect element button in the upper left corner of the debugging tool; then in the styles tab, click the link next to the CSS rule and open the definition Regular external style sheet; finally view the source file of the style.

css video tutorial》
chrome devtools is a debugging tool that front-end developers are no longer familiar with. So how much do we know about it? Here is a summary of some common CSS debugging operations. View CSSView the style corresponding to the element1. Open the debugging tool, click the check element button in the upper left corner of the debugging tool or the shortcut key (Ctrl/Cmd Shift C) 2. Select the element you want to view on the page. The inspected element is highlighted with a blue background in the DOM tree, and the style is in the
styles tab area on the right. 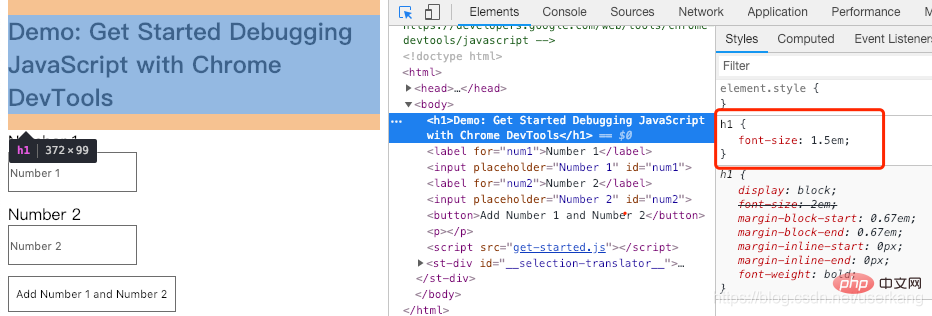
styles tab, click the link next to the CSS rule to open the external style that defines the rule surface. You can view the source file of the style. 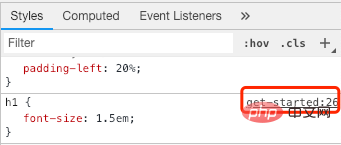
styles The tab will display all rules that apply to the element, including those that have been Overridden declarations. If you are not interested in overridden declarations, you can click the computed tab adjacent to styles to see only the CSS rules actually applied to the element.
Show All checkbox to view all inherited values.
Filter The filter can search for styles that match the rules according to the query rules.
styles tab. 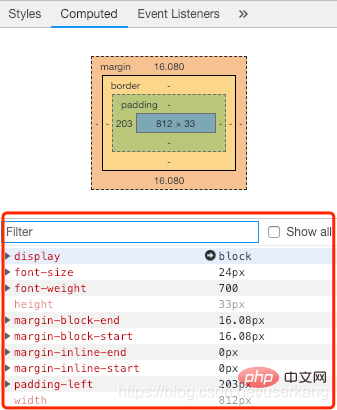
:hov in the styles tab. Taking :hover as an example, select the :hover checkbox. If the checked element has the
:hover style added to it, it will appear in the style list. This bar style will be displayed. And the page effect will trigger the display effect without mouse hovering. 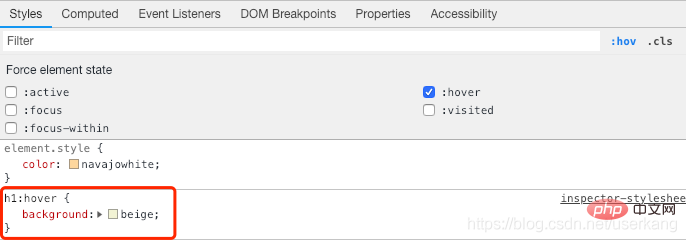
style attribute to HTML attribute value. Click the area near the top of element.style, enter the newly added style attribute name, press the Tab key, enter the style attribute value, and press the Enter key. This adds an inline style. 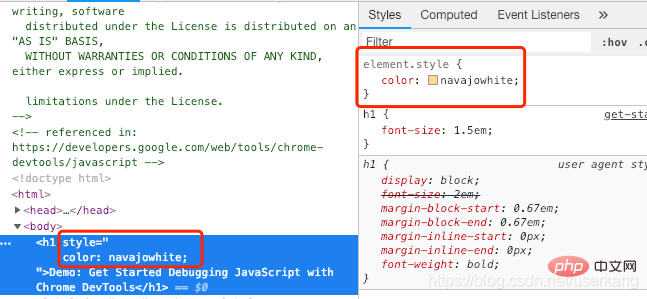 2. View the effect:
tab key, enter the attribute value, and press Enter.
Enter key.
.cls in the styles tab. An Add new class input box will be displayed. You can enter the class name you want to add, and then press the Enter key. 
title to switch styles back and forth.
1. Click the plus sign 1➕ in the upper right corner of the styles tab, DevTools will insert a rule under the element.style rule New rules.
2. If you want to add a new style rule at a specific position, you can hover the mouse over the previous style rule where the rule was inserted. At this time, three dots for more operations will appear in the lower right corner. Hover the x Plus sign 2➕ will appear. Clicking plus sign 2 will add a style rule after this style.
3. There are other functions for more operations here. From left to right, they are text shadow, box shadow, text color, and background color. 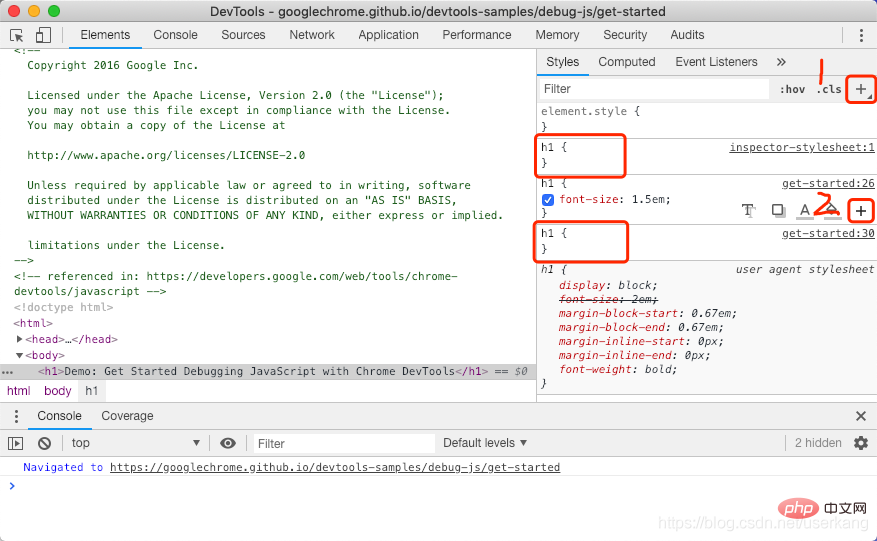
1. Click the check box before the style declaration to switch the style declaration
1. In the box model diagram of the styles tab, hover the mouse over the area that needs to be edited, double-click, fill in the value that needs to be modified, and press Enter. The default unit of the box model is pixels, and the input percentage will also be converted into pixel values. 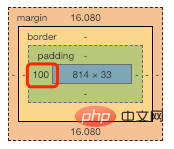
When editing the value of a declaration, you can use the following keyboard shortcuts to increment the value by a fixed amount:
Reduction is also effective. Simply replace each instance of Up mentioned above with Down.
1. Press Command Shift P (Mac) or Control Shift P (Windows, Linux, Chrome OS) while DevTools Take focus to open a menu of commands.
2. Start typing coverage and select Show Coverage. The coverage tab will be displayed. 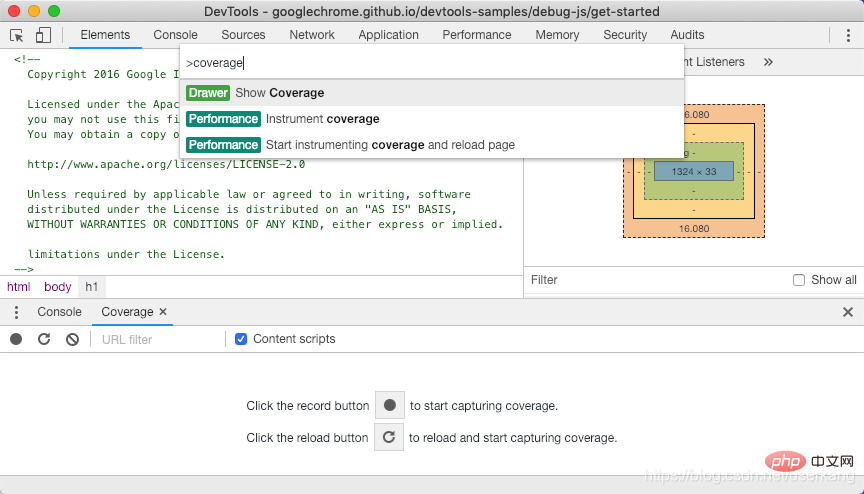
3. Click "to reload and start capturing coverage" to start detecting coverage and reload the page. As the page reloads, the Coverage tab provides an overview of how much CSS (and JavaScript) is used by each file loaded by the browser. Green means using CSS. Red indicates unused CSS. 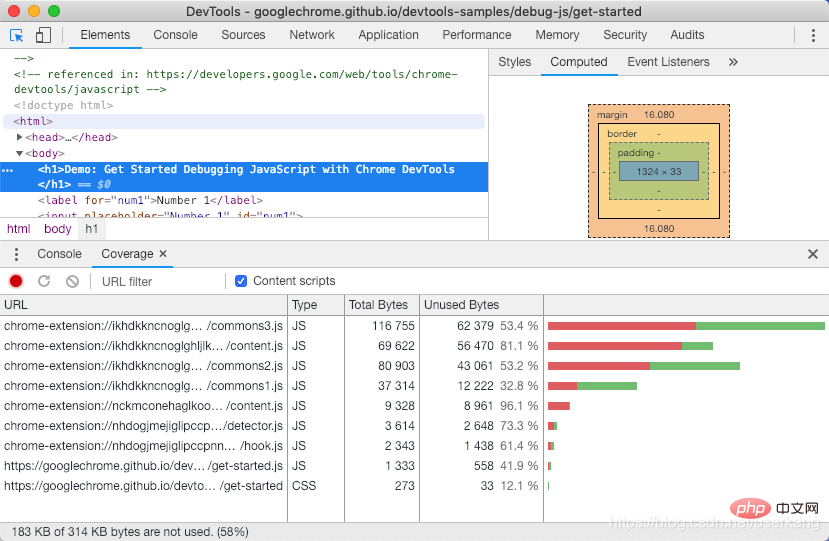
4. Click on a CSS file to see a line-by-line breakdown of the CSS it uses. 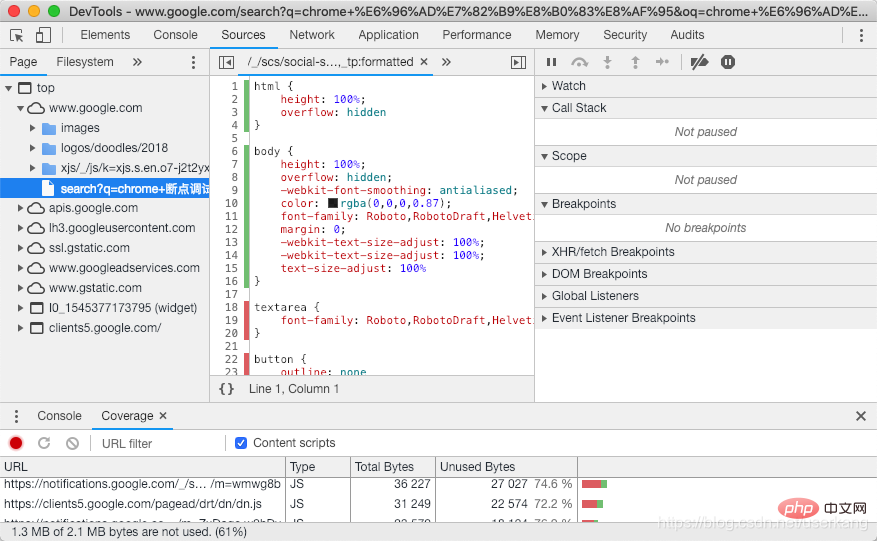
The following is a description of each UI element of the color picker:
1. Shadow .
2. Straw.
3. Copy to clipboard. Copies the displayed value to the clipboard.
4. Display value. Color representation in RGBA, HSLA or Hex.
5. Color palette. Click on one of the squares to change the color for that square.
6. Hue.
7. Transparency.
8. Display value switcher. Switch between RGBA, HSLA and Hex representation of the current color.
9. Palette switcher. Switch between the Material Design palette, custom palette, or page palette. DevTools generates the page color palette based on the colors it finds in the style sheet. 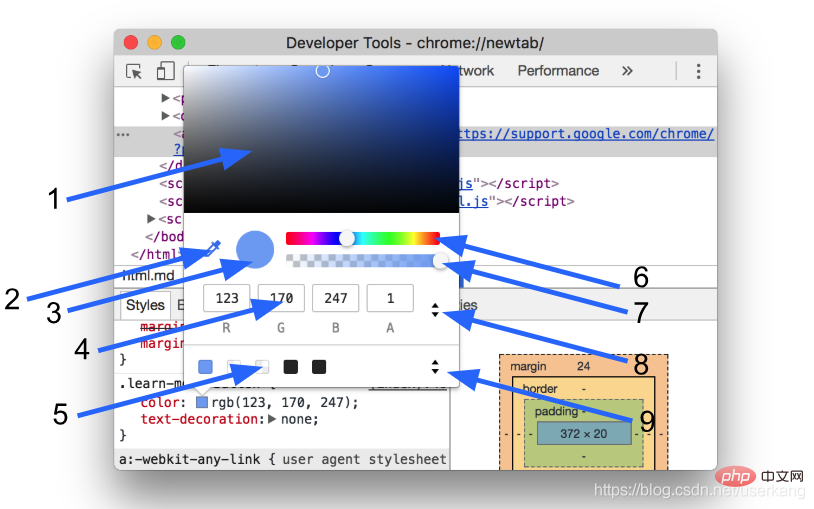
When you open the Color Picker, the Eyedropper is on by default. To change the selected color to another color on the page:
1. Hover over the target color in the viewport.
2. Click Confirm.
The above is the detailed content of How to view css code in chrome developer tools. For more information, please follow other related articles on the PHP Chinese website!