

How to debug in node.js?

Related recommendations: "nodejs Tutorial"
After using node.js for a few days, I feel very novel, but the debugging problem is really frustrating. , at the beginning, I lazily learned the debugging method and just looked at the exception content. However, as the complexity of the code increased, not all errors were syntax errors. It was impossible to solve the problem without debugging, so I had to search for information and learn. How to debug it.
Supervisor that does not need to restart the service every time
Students who have used PHP must know that after modifying a script file, the new content will be loaded as long as the page server is refreshed, but node .js will put it into the memory after parsing it for the first time when it references a file. The next time it is accessed, it will be retrieved directly from the memory to improve efficiency. However, this caused some trouble for our development. After modifying a certain module It can only take effect after restarting the server, and the debugging efficiency is still very low.
So there is a supervisor plug-in in node.js to help us make file changes and automatically restart the server. Supervisor is a package of node.js. It is very simple to install. Just use the npm installation command, because we It needs to be run in the console, so it needs to be installed in the global environment
npm install -g supervisor
So we can use the supervisor to start the script
supervisor index
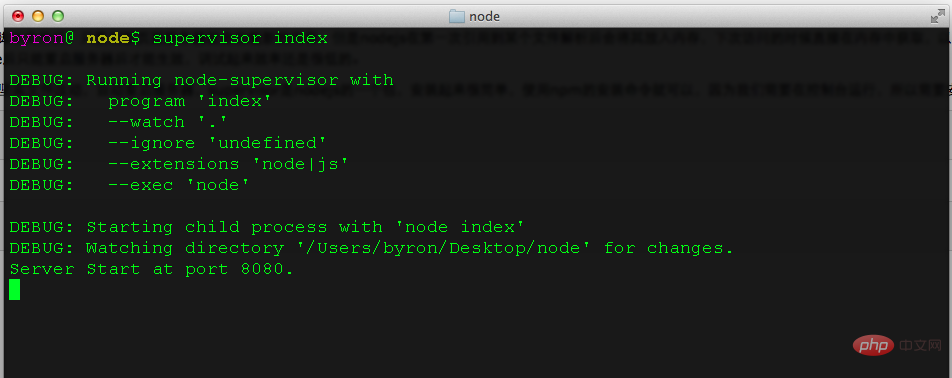
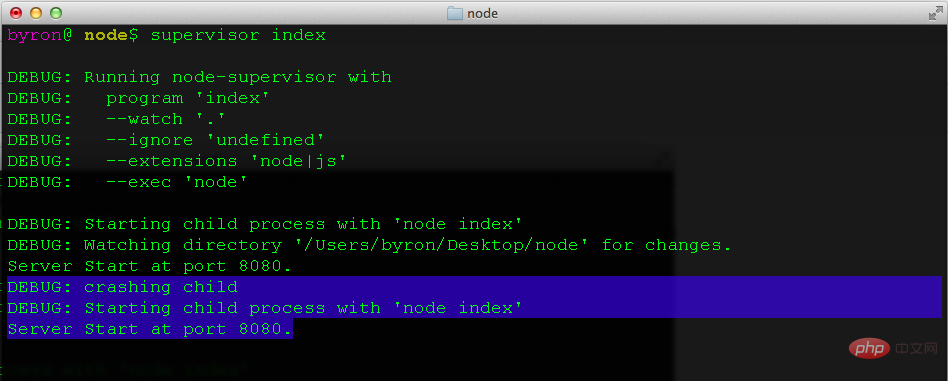
When we do something to the file When making changes, you can see that there are three more lines in the console and the server has been restarted
Native console debugging
node.js itself supports debugging , you can add a breakpoint by adding the debugger command in front of the statement
var server=require('./server'),
    router=require('./router'),
    requestHandlers=require('./requestHandlers');debugger;var handle={};debugger;
handle['/']=handle['/start']=requestHandlers.start;debugger;
handle['/upload']=requestHandlers.upload;
handle['/show']=requestHandlers.show;debugger;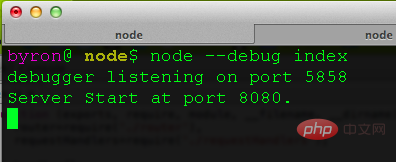
server.start(8080,router.route,handle);Add the debug option when starting the service
node debug index.js
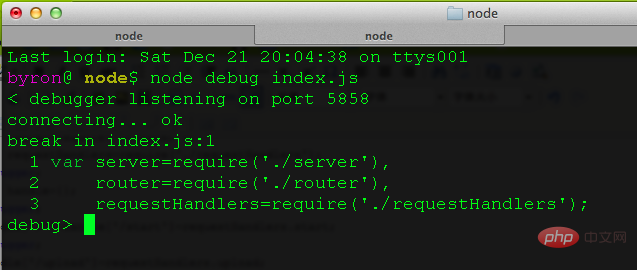
Enter some commands at this time You can single-step debug, monitor local variables at breakpoints, etc. Look at the command diagram. Many commands have their abbreviations
| Command | Function |
| run | Execute the script, pause on the first line |
| restart | Re-execute the script |
| Continue Execute until the next breakpoint is encountered |
|
| Single-step execution | |
| Single step execution and enter the function | |
| Step out of the function | ##setBreakpoint(), sb() |
| Set a breakpoint on the current line | |
|
|
|
##clearBreakpoint, cb(...) |
| ##Clear all breakpoints |
backtrace, bt |
| Display the current call stack |
list(5) |
| Display the 5 lines of code currently executed before and after |
watch(expr) |
| Add the expression expr to the watch list | ##unwatch(expr)|
|
|
|
|
|
|
|
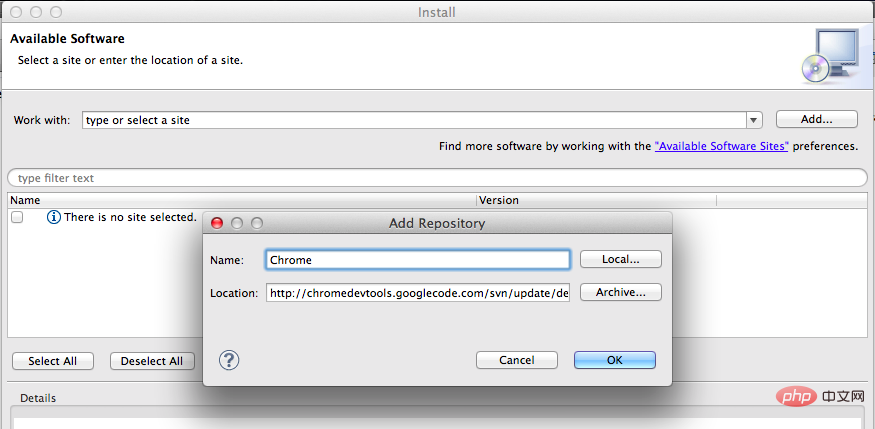
详细使用有兴趣同学可以自己摸索,我是没兴趣。。。太复杂了,看几个贴心的 使用Eclipse调试是的,Eclipse又威武了,连node.js也能调试,在Eclipe官网上下载eclipse,然后 Help->Install New Software->Add 在弹出的窗口添加一个源,名字好记就行,地址是http://chromedevtools.googlecode.com/svn/update/dev/
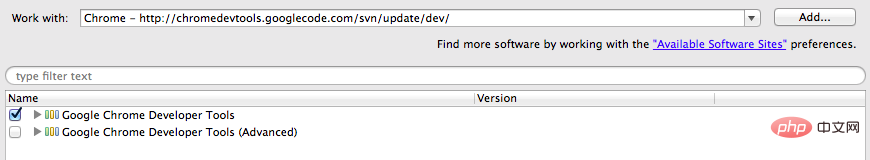
等一会儿后弹出选择界面,选中第一个
一路next到最后finish,下载完成后会提醒重启Eclipse,完成之后就可以调试node.js了,打开想调试的文件,切换Eclipse到调试视图,点击工具栏右边的小三角,选择Debug Configuration
双击 Standard V8 VM 选项创建一个新的配置,填好相应参数
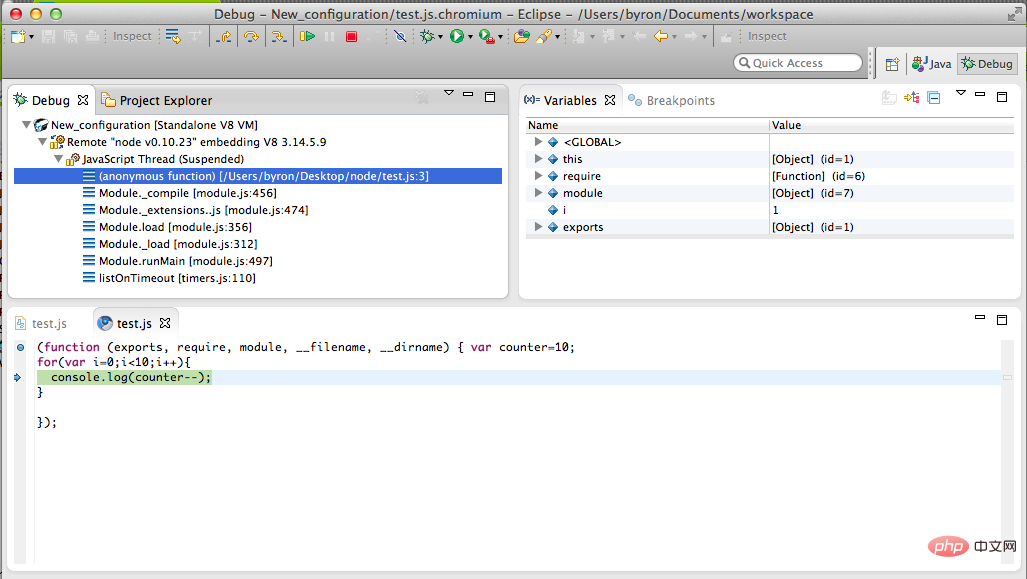
通过 --debug-brk选项在控制台启动node服务器 node --debug-brk=5858 test.js Copy after login 点击Eclipse刚才界面的debug按钮,就可以像调试Java一样调试node.js了
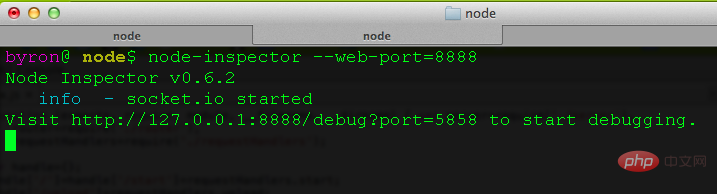
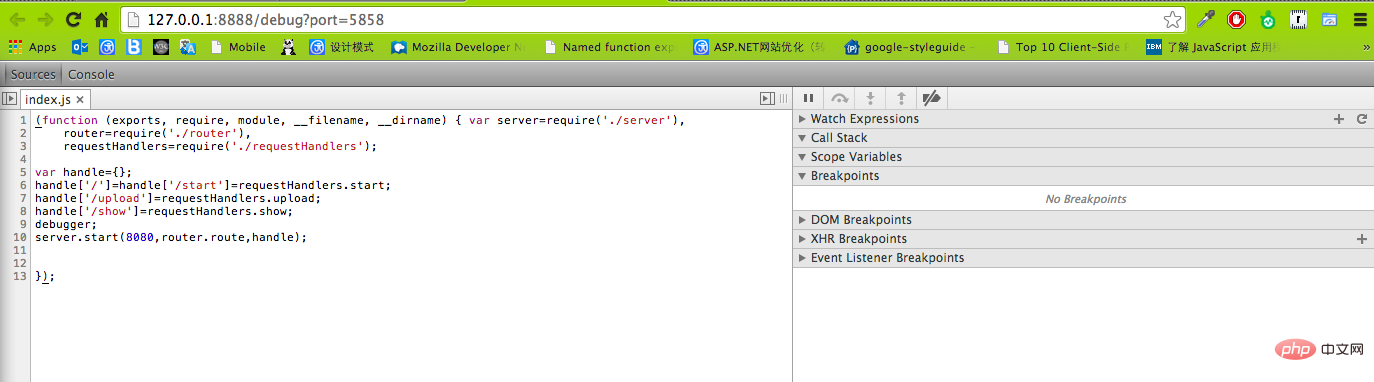
使用node-inspector调试大部分node.js应用都是web应用,所以一些基于Chrome的在线调试工具应运而生,最出名的应该就是node-inspector了,这是一个node.js的模块,安装、使用相当的方便,首先使用npm把其安装在全局环境中 npm install -g node-inspector Copy after login node-inspector是通过websocket方式来转向debug输入输出的。因此,我们在调试前要先启动node-inspector来监听node.js的debug调试端口。默认情况下node-inspector的端口是8080,可以通过参数--web-port=[port]来设置端口。
在启动node-inpspector之后,我们可以通过--debug或--debug-brk来启动node.js程序。
这时候就可以访问http://127.0.0.1:8888/debug?port=5858 使用浏览器调试了,看看界面,不用多说什么了吧
最后参考:node.js开发指南 PS:个人觉得还是最后一种最方便 更多编程相关知识,请访问:编程学习网站!! |


The above is the detailed content of How to debug in node.js?. For more information, please follow other related articles on the PHP Chinese website!

Hot AI Tools

Undresser.AI Undress
AI-powered app for creating realistic nude photos

AI Clothes Remover
Online AI tool for removing clothes from photos.

Undress AI Tool
Undress images for free

Clothoff.io
AI clothes remover

AI Hentai Generator
Generate AI Hentai for free.

Hot Article
Hot Tools

Notepad++7.3.1
Easy-to-use and free code editor

SublimeText3 Chinese version
Chinese version, very easy to use

Zend Studio 13.0.1
Powerful PHP integrated development environment

Dreamweaver CS6
Visual web development tools

SublimeText3 Mac version
God-level code editing software (SublimeText3)
Hot Topics
 1386
1386
 52
52

 Detailed explanation of C++ function debugging: How to debug problems in multi-threaded functions?
May 02, 2024 pm 04:15 PM
Detailed explanation of C++ function debugging: How to debug problems in multi-threaded functions?
May 02, 2024 pm 04:15 PM
C++ multi-thread debugging can use GDB: 1. Enable debugging information compilation; 2. Set breakpoints; 3. Use infothreads to view threads; 4. Use thread to switch threads; 5. Use next, stepi, and locals to debug. Actual case debugging deadlock: 1. Use threadapplyallbt to print the stack; 2. Check the thread status; 3. Single-step the main thread; 4. Use condition variables to coordinate access to solve the deadlock.
 How to use LeakSanitizer to debug C++ memory leaks?
Jun 02, 2024 pm 09:46 PM
How to use LeakSanitizer to debug C++ memory leaks?
Jun 02, 2024 pm 09:46 PM
How to use LeakSanitizer to debug C++ memory leaks? Install LeakSanitizer. Enable LeakSanitizer via compile flag. Run the application and analyze the LeakSanitizer report. Identify memory allocation types and allocation locations. Fix memory leaks and ensure all dynamically allocated memory is released.
 Shortcut to golang function debugging and analysis
May 06, 2024 pm 10:42 PM
Shortcut to golang function debugging and analysis
May 06, 2024 pm 10:42 PM
This article introduces shortcuts for Go function debugging and analysis, including: built-in debugger dlv, which is used to pause execution, check variables, and set breakpoints. Logging, use the log package to record messages and view them during debugging. The performance analysis tool pprof generates call graphs and analyzes performance, and uses gotoolpprof to analyze data. Practical case: Analyze memory leaks through pprof and generate a call graph to display the functions that cause leaks.
 How to do efficient debugging in Java lambda expressions?
Apr 24, 2024 pm 12:03 PM
How to do efficient debugging in Java lambda expressions?
Apr 24, 2024 pm 12:03 PM
Efficiently debug Lambda expressions: IntelliJ IDEA Debugger: Set breakpoints on variable declarations or methods, inspect internal variables and state, and see the actual implementation class. Java9+JVMTI: Connect to the runtime JVM to obtain identifiers, inspect bytecode, set breakpoints, and monitor variables and status during execution.
 How to debug PHP asynchronous code
May 31, 2024 am 09:08 AM
How to debug PHP asynchronous code
May 31, 2024 am 09:08 AM
Tools for debugging PHP asynchronous code include: Psalm: a static analysis tool that can find potential errors. ParallelLint: A tool that inspects asynchronous code and provides recommendations. Xdebug: An extension for debugging PHP applications by enabling a session and stepping through the code. Other tips include using logging, assertions, running code locally, and writing unit tests.
 How to conduct concurrency testing and debugging in Java concurrent programming?
May 09, 2024 am 09:33 AM
How to conduct concurrency testing and debugging in Java concurrent programming?
May 09, 2024 am 09:33 AM
Concurrency testing and debugging Concurrency testing and debugging in Java concurrent programming are crucial and the following techniques are available: Concurrency testing: Unit testing: Isolate and test a single concurrent task. Integration testing: testing the interaction between multiple concurrent tasks. Load testing: Evaluate an application's performance and scalability under heavy load. Concurrency Debugging: Breakpoints: Pause thread execution and inspect variables or execute code. Logging: Record thread events and status. Stack trace: Identify the source of the exception. Visualization tools: Monitor thread activity and resource usage.
 What are the debugging techniques for recursive calls in Java functions?
May 05, 2024 am 10:48 AM
What are the debugging techniques for recursive calls in Java functions?
May 05, 2024 am 10:48 AM
The following techniques are available for debugging recursive functions: Check the stack traceSet debug pointsCheck if the base case is implemented correctlyCount the number of recursive callsVisualize the recursive stack
 PHP Debugging Errors: A Guide to Common Mistakes
Jun 05, 2024 pm 03:18 PM
PHP Debugging Errors: A Guide to Common Mistakes
Jun 05, 2024 pm 03:18 PM
Common PHP debugging errors include: Syntax errors: Check the code syntax to make sure there are no errors. Undefined variable: Before using a variable, make sure it is initialized and assigned a value. Missing semicolons: Add semicolons to all code blocks. Function is undefined: Check that the function name is spelled correctly and make sure the correct file or PHP extension is loaded.
